Trends in Prescription Drug Spending
Measuring and understanding cost trends will help address increasing pharmaceutical costs May 2020Photo: iStock.com/Svetlana Ustinova
Some of the most frequent questions actuaries get about prescription drug spending are: Where is it going, how much will we be spending next year, in five years, in 10? This article will look at where trends have been in the past and where they are headed. The word “trend,” like many other terms used both popularly and technically, has come to mean different things, so this paper will lay out some definitions for clarity.
Unit Cost
Trend is a measure of unit change over time, although it often has come to mean the ratio of one time period’s results to another’s. Pharmacy costs can be expressed as total dollars spent, but it can also be separated into the number of uses and the cost per use in order to understand each component. This is a more robust means of accurately tracking the drivers of increasing pharmacy spend.
Unit costs, for example the cost per 30-day script, have trends that depend on price inflation and market basket mix. In a pharmacy trend, the unit cost can be defined several ways. Unit cost is often one of the following, although this is not an exhaustive list:
- Ingredient cost = the actual cost of the drug or device itself
- Allowed cost = ingredient cost + dispensing fee
- Paid cost = allowed cost – member cost-share
- Net cost = paid cost – rebate
Administrative fees may or may not be included in the paid cost or in the net cost depending on definitions and methodologies. Alternatively, administrative fees may be reported separately and not included in either the paid cost or the net cost.
Average ingredient costs will depend on the negotiated price levels for each drug and reflect inflationary price changes, as well as the mix of drugs included in the market basket. True base ingredient costs can be difficult to pin down due to the lack of a single pricing methodology, although there are National Drug Code pricing lists with prices published continuously throughout the year. Ingredient cost trend is influenced by factors such as the percent of generic drugs, which tend to be much less expensive than brand-name drugs. It is also influenced by the increase in specialty medications, which are not only more expensive, but also have high unit cost trends. The smaller the population used to measure the trend number, the more sensitive it is to unit cost trends because the addition of a few members using expensive therapies could have a dramatic impact on the average ingredient cost.
Administration and dispensing fees are often on a per-script or per-member per-month basis, and they tend to have much less volatility than the cost of the drugs themselves, unless they are based on a percent of total cost.
The unit cost calculation where ingredient cost equals the actual cost of the drug or device itself is a popular version because it is most closely tied to the cost of the prescription. The measured trend is tied more directly with drug inflation and changes in therapeutic mix, though benefit design and management also contribute to changes in the mix of drugs.
Removing member cost-share from the equation results in the amount the payer will spend and reflects the role of benefit design in addressing inflationary pressure on budgets. Over the years, there has been a transfer of costs to the beneficiary for lower cost drugs. But, since most benefit designs cap the beneficiary responsibility, the member cost component for the most expensive drugs, especially specialty medications, has declined. Static benefit designs can result in leveraged trends in paid cost due to the combination of rising drug prices and declining member cost-share.
Cost net of rebates (net cost) has historically not been published externally but may be used for the analysis of large groups, market experience and for programs such as Medicaid, which track rebates closely. This is an area of increasing scrutiny as states look to a more proactive approach to managing their drug benefits. Aggressive rebating strategies can result in lowering unit costs if a total cost strategy is followed. Without understanding the rebate strategy, the allowed cost trend may overstate the total impact of drug costs to the system.
Utilization
Measures of utilization of pharmacy, for example the number of scripts per person per year, have trends that depend on such things as demographics, emerging therapies and changes in demand. In general, the older a population, the higher the pharmaceutical use. Geography plays a role with varying practice patterns, as well as emerging treatment conventions, such as the reduced use of antibiotics for inner ear infections. Disease identification and prevalence will cause utilization to increase, as was observed with the increased identification of ADHD accompanied by a large increase in medications to manage the condition. There is some evidence to show that increased cost-share due to benefit design or inflation can suppress utilization, particularly in lower-income or fixed-income populations. Changes to regulations, such as the coverage of birth control, will also change utilization patterns.
Recent and Long-term Cost Trends
Each year the Centers for Medicare and Medicaid Services (CMS) Office of the Actuary releases a study of national health expenditures, which looks back over the years at expenses by treatment categories, payer/coverage type and sponsor. Pharmacy costs warrant an examination because of the large contribution to cost as well as their volatility over time. There is an expectation that pharmacy trends will continue to be moderate, but not insignificant, in the next decade.
Figures 1 and 2 show the increase in total expenditure by person, so they do not reflect any reduction due to cost-share or rebates, followed by a trend by year. In the 1990s, drug trends were in the mid to high teens, exceeding total health cost trends. This reflected the emergence of some blockbuster brand medications for a large number of common conditions, such as heart disease and diabetes. As generics emerged, the trend moderated through 2014. Then came the cure for Hepatitis C, along with a sharp rise in treatment costs for autoimmune diseases, as well as an increase in their diagnosis rates. The peak of the increase stands out in Figure 2 (years 2014–2016), but quickly drops off as the unit costs for Hepatitis C treatments plummeted and the backlog of people previously diagnosed (and those previously undiagnosed), received the treatment.
Figure 1: Nominal and Inflation-adjusted Per Capita Spending on Retail Prescription Drugs, 1960–2017
Hover Over Image for Specific Data
Source: Kaiser Family Foundation analysis of National Health Expenditures Accounts
Figure 2: Annual Change in Per Capita Prescription Drug Spending, 1970–2017; Projected 2018–2027
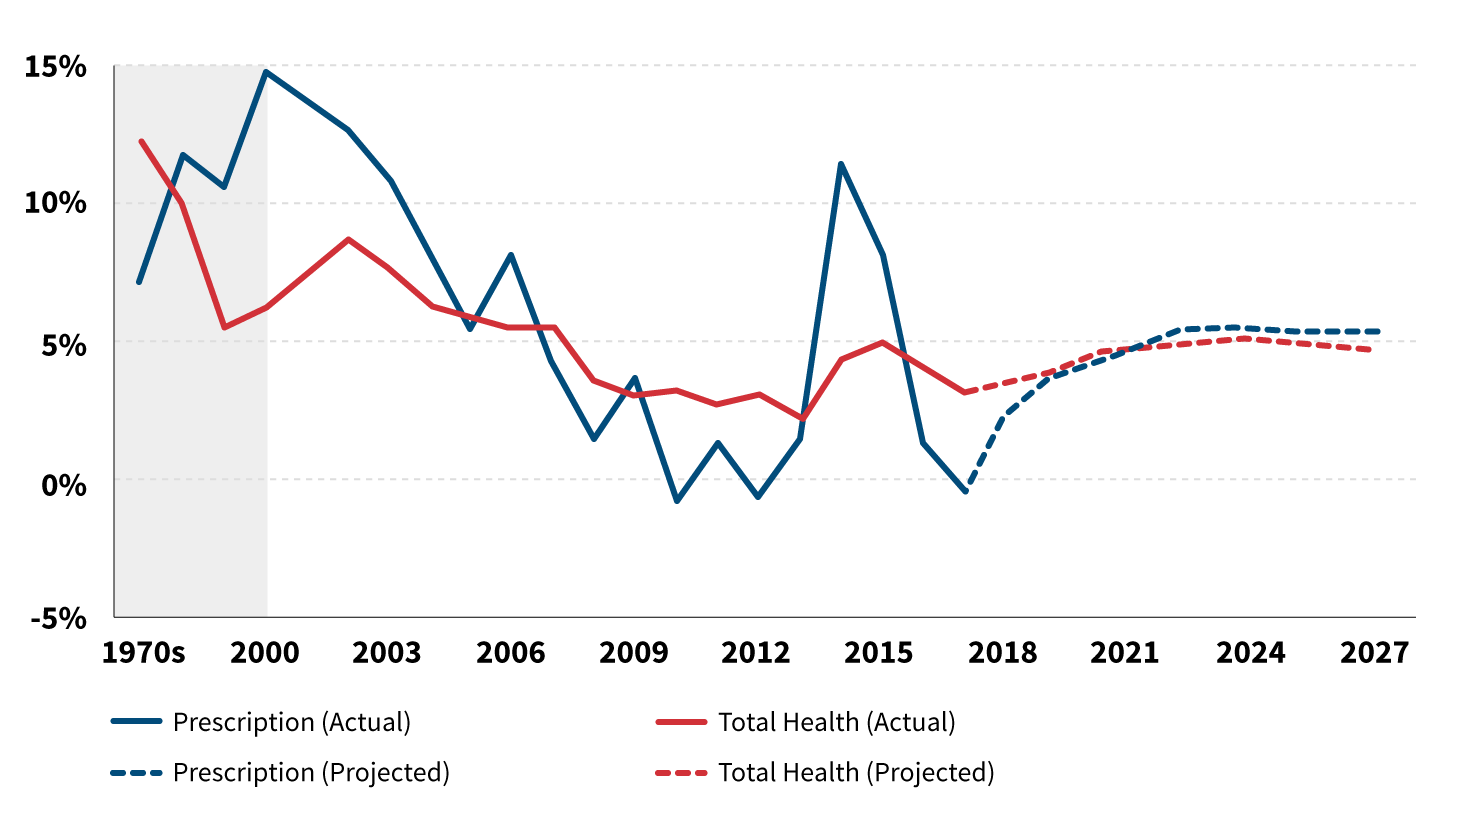
Source: Kaiser Family Foundation analysis of National Health Expenditures Accounts
Note: Gray region represents average growth within decade.
Two large programs also contributed to trends in per capita spending as well as overall growth in spending. As of January 2006, Medicare Part D changed the landscape for retiree drug coverage. Then the Affordable Care Act (ACA), with both the expansion of Medicaid and the reduction in the uninsured, led to a significantly larger number of people having access to benefits.
The cumulative impact of year after year of trend increases is a sobering thing to consider. The advent of specialty drugs and the movement of cancer treatments from hospital to self-administration is pronounced as the years progressed. Spend related to specialty drugs is often more than 50 percent of the total pharmaceutical cost for a given population, with double-digit cost and utilization growth as new treatments emerge. In some ways, specialty is an umbrella category that comprises different populations—people with acute needs that will only use the drugs for a short period of time, people with fairly prevalent chronic diseases who will need maintenance drugs and the orphan disease category with extremely expensive therapies that may be short or long term. Each of these populations will contribute very differently to the pharmacy trend.
Figure 3 breaks down the recent drivers of cost trend highlighting the importance of new therapeutics to the increases in spending. The new brand component of the drivers is overwhelmingly in specialty medications. A look at one of the major components of specialty drug spend can shed some light on what makes the specialty category so important. Arthritis is not just aching joints in the aged, but rather encompasses everything from twinges to a debilitating autoimmune disorder. The prevalence of arthritis, like most other autoimmune disorders, has grown continuously over the past few decades and shows no sign of tapering off.
Figure 3: Contribution to Growth in Drug Spending, by Spending Growth Drivers, in $US Billions, 2011–2017
Hover Over Image for Specific Data
Source: IQVIA, Medicine Use and Spending in the U.S., April 2018; IQVIA Institute of Human Data Science
Note: New brands are protected branded products on the market less than 24 months during the year reported. Protected brands are products that are no longer “new” and have yet to reach patent expiry. Loss of Exclusivity (LOE) are brands that were once protected and have since lost patent protection. Generics include both unbranded and branded generics. All segments exclude hepatitis C treatments. Hepatitis C spending growth is reported separately from the other segments because usually there are declines in spending in both the new and protected segments for these drugs.
While the causes may be in dispute, there is no question that the treatments available are high-trend expense items. The recent price history of Humira, one of the most important therapeutics in arthritis treatment, is a good example (see Figure 4).
Figure 4: Humira Price Increases, January 2016 to January 2019
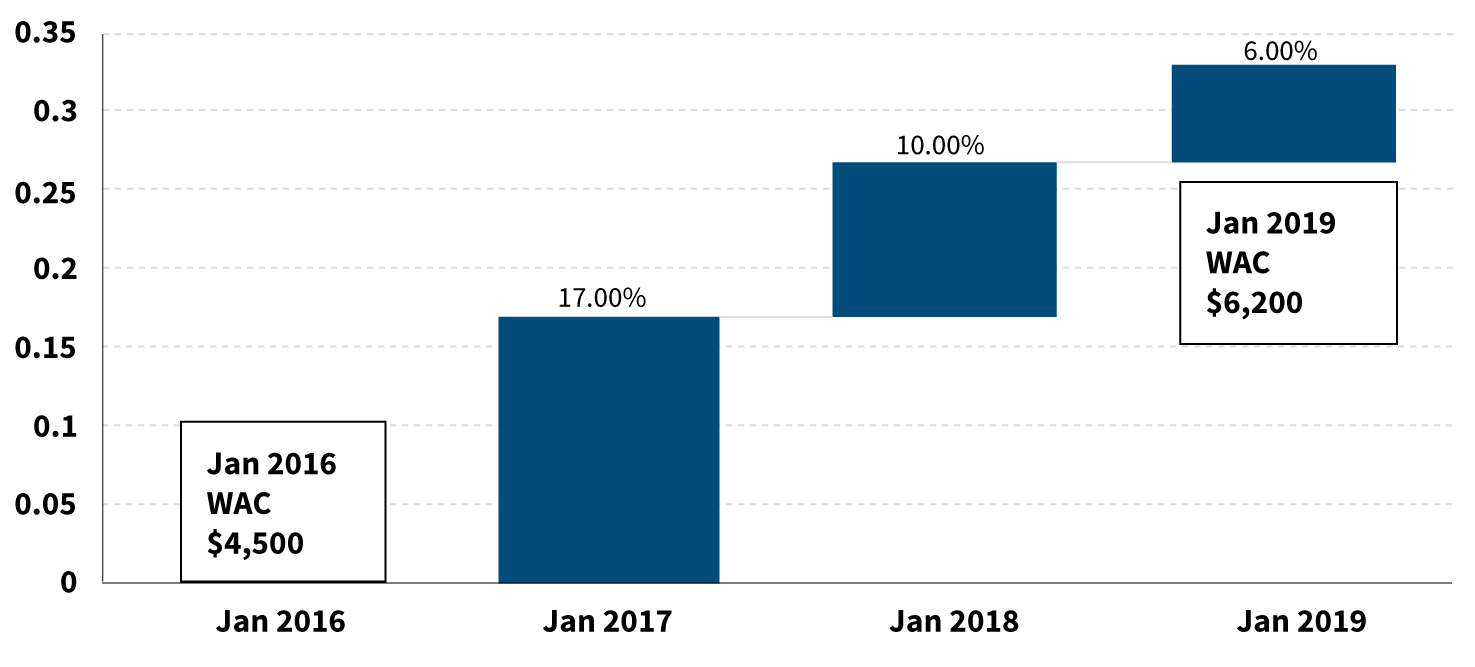
Source: Created by Rebecca Owen from pricing/experience files based on Medi-Span history
Conclusion
Pharmacy cost trends have several different causes, from an aging population to increasing costs for older medications to brand-new drugs with six-figure prices. Understanding the myriad causes of pharmacy inflation can help us develop solutions that will successfully address the issues. Increases in pharmacy cost due to an aging and growing U.S. population are probably unavoidable and reflect the resources needed to care for a changing country. Cost increases related to extremely expensive treatments for orphan conditions could be managed by tying payments to outcomes or the avoidance of other medical expenses (e.g., hospital admissions).
Whatever solutions are proposed to address the challenge of increasing pharmaceutical costs, measuring cost trends and understanding the underlying components of those trends will be essential for measuring our progress. Actuaries have an important role to play in ensuring this happens so that patients in the United States can have better access to better health outcomes at more affordable costs.
Copyright © 2020 by the Society of Actuaries, Schaumburg, Illinois.