
Better Retirement Benefits
Designing retirement plans with employee preferences in mind
October 2023During the height of the Great Resignation in 2022, 50 million workers quit their jobs, outpacing the record set in 2021, according to the U.S. Bureau of Labor Statistics. While resignations have slowed in 2023, the labor market remains extremely tight, unemployment rates are near 53-year lows, and recruiting and retaining employees continues to be a challenge. In response, employers are exploring new tactics, such as enhancing benefits packages.
With this environment in mind, employers might want to take note that an increasing number of workers find it difficult to save for retirement. A recent online survey conducted by Deloitte Consulting on behalf of the Society of Actuaries (SOA) Research Institute and Retirement Section found that only 41% of respondents said they were on course for retirement savings. Another 40% of respondents were uncomfortable about their current retirement savings, and nearly 1 in 5 said they had no retirement savings at all.
The SOA Research Institute released the “What Retirement Plan Features Do Employees Really Want?” report, which analyzes responses to the online survey and uncovers ways in which employers might find common ground with employees’ preferences as they enhance or implement new retirement plans. The research applied choice-based conjoint analysis, which is an approach that requires respondents to select between alternative hypothetical packages, and it distills preferences for specific features by analyzing all respondents’ choices. In addition to providing a report highlighting their analysis, the researchers created a Choice Simulator Tool. This Excel-based dashboard enables users to build retirement packages with varying features and compare respondent preferences.
This article provides a summary of the SOA Research Institute report findings, including observations on what these findings could mean for employers.
Availability of Retirement Plans
The most common type of retirement benefit for those surveyed was a company-provided retirement savings plan with employer contributions. However, less than half of actively working respondents (49%) said one is available at their current job. The snapshot of other responses, as shown in Figure 1, reveals:
- 27% had a pension plan with their current employer.
- 13% had a retirement savings plan without employer contributions.
- 16% had neither pension nor retirement savings plans at their current or past jobs.
Figure 1: Access to Retirement Plans Through an Employer (Actively Working Respondents)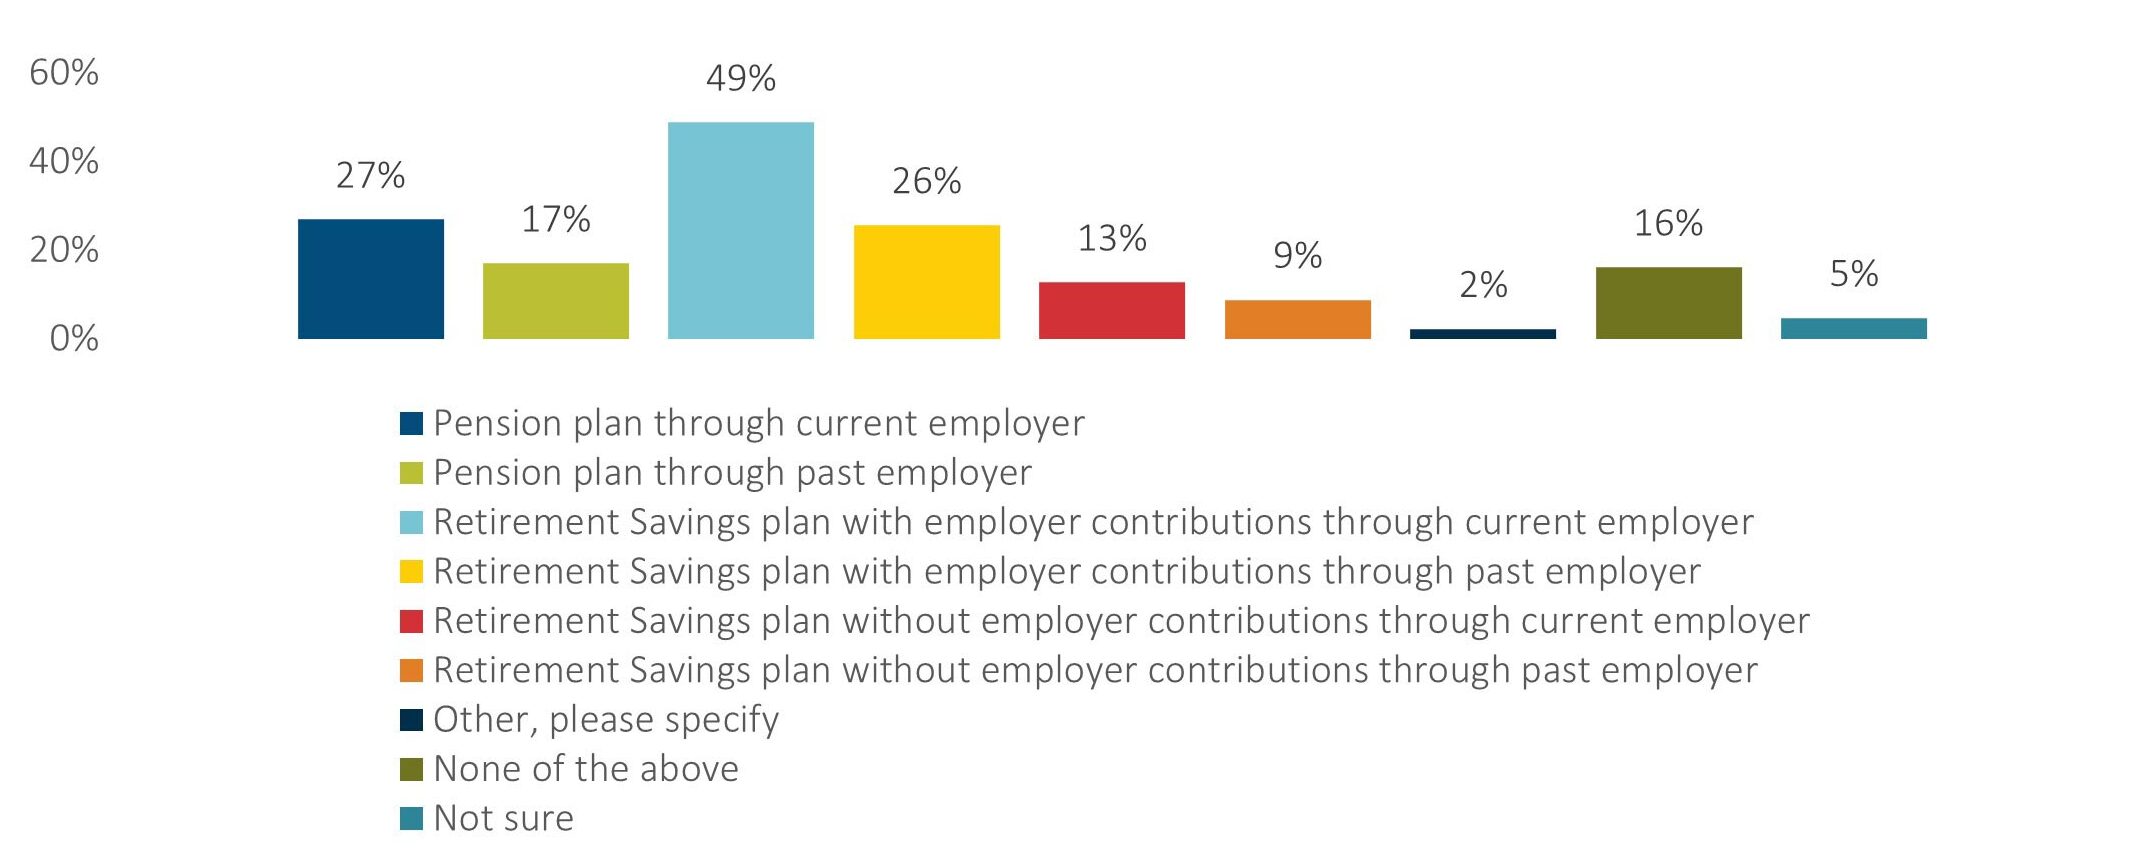
Additionally, the survey found that a quarter of respondents aged 18 to 24 didn’t know what, if any, retirement benefits their employers offered.
Employer Opportunity
Because less than half of respondents strongly agreed that they are on track for planning a secure retirement, employers that do not currently have company-sponsored retirement plans could improve retention and recruitment by launching such programs. Educating younger workers about existing programs also could be an effective tactic to improve employee satisfaction.
Retirement Income
The survey uncovered what workers expected their sources of income to be after they retired. Social Security came in as the most cited primary source, with withdrawals from an employer-sponsored retirement savings plan coming in second.
Furthermore, it’s probably not surprising that respondents preferred for their employers to fund 100% of their retirement savings. However, imposing some level of cost-sharing on employees did not severely affect popularity. Nonetheless, cost-sharing options of more than 50% led to a substantial reduction in preferability, as shown in Figure 2.
Figure 2: Utility Scores: Plan Contribution Requirements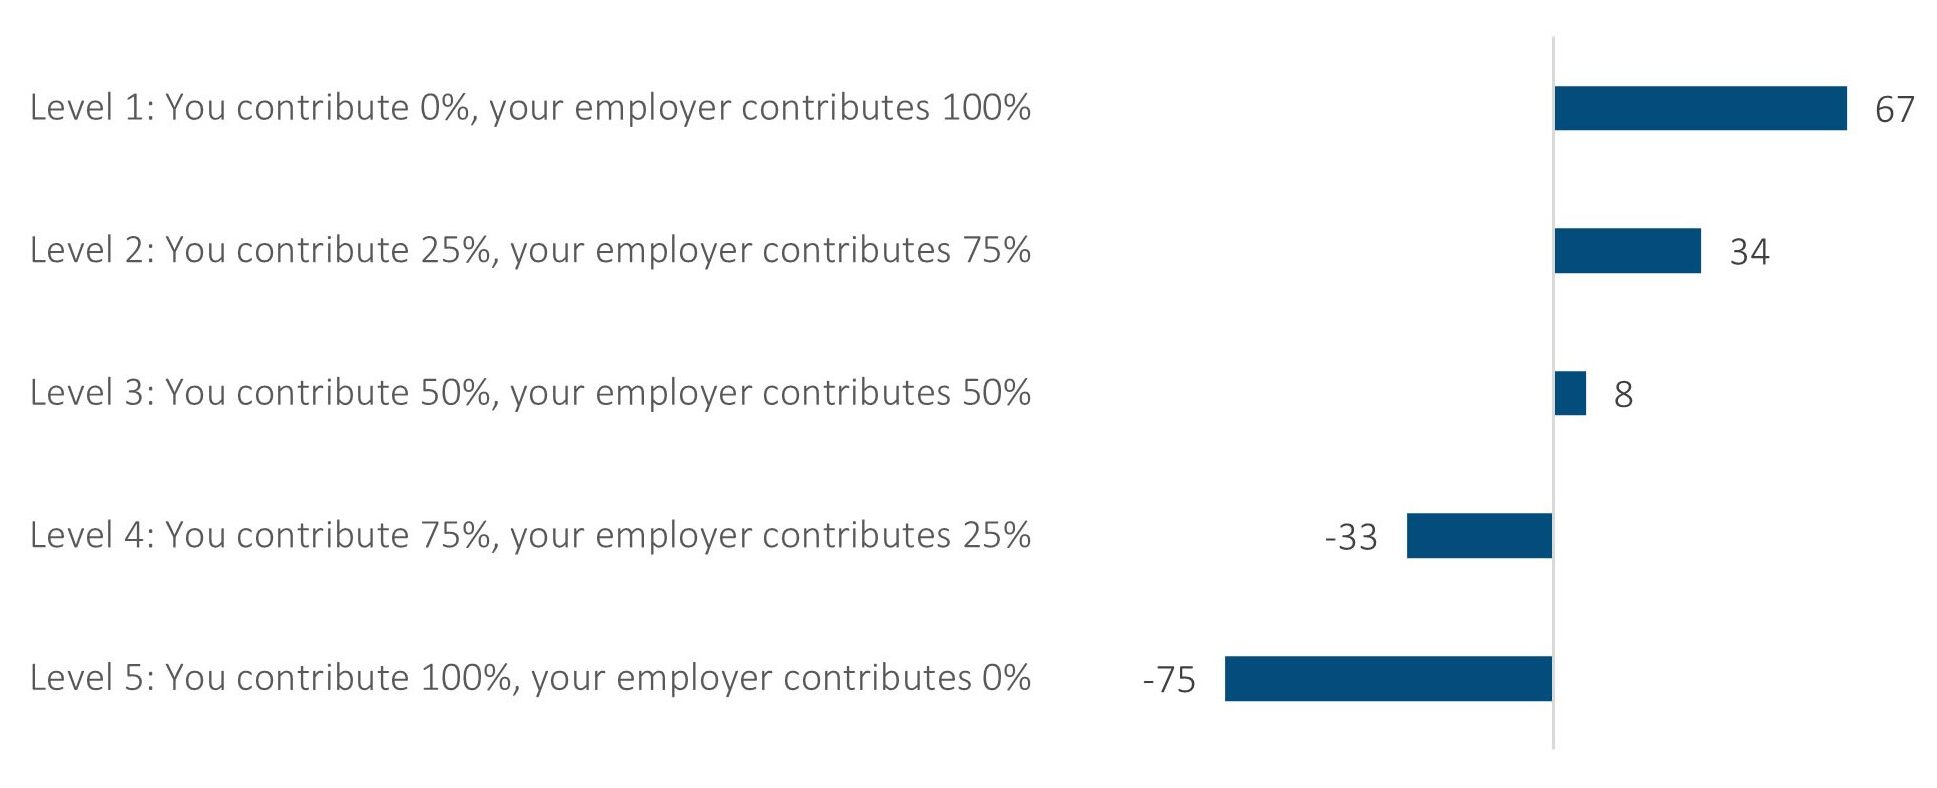
Note: Utility scores provide an ability to both order the preferability of choices and indicate the intensity differences between preferences. In this figure, the 41-point difference between 50% employee contribution and 75% employee contribution is more significant than the difference between 25% and 50% contributions, which shows a 26-point difference.
Employer Opportunity
Increasing the employer portion of the plan’s total cost likely will boost employee satisfaction, while decreasing the employer portion of costs likely will lead to higher dissatisfaction. The level of decreased satisfaction is expected to be most pronounced when changing employee cost-sharing levels above 50%.
Age Requirements for Full Benefits
When asked about the minimum eligibility age for full retirement benefits, respondent preference was unsurprisingly the youngest choice available in the survey, 62 years (as shown in Figure 3). They also seemed to have a tolerance for waiting until age 65 and even 67. However, ages above 67 dropped off sharply in preference. So, while many employees may wish to retire earlier, waiting until ages 65 to 67 might not seem unreasonable to workers.
Figure 3: Utility Scores: Earliest Age at Which You Can Receive Your Full Retirement Benefit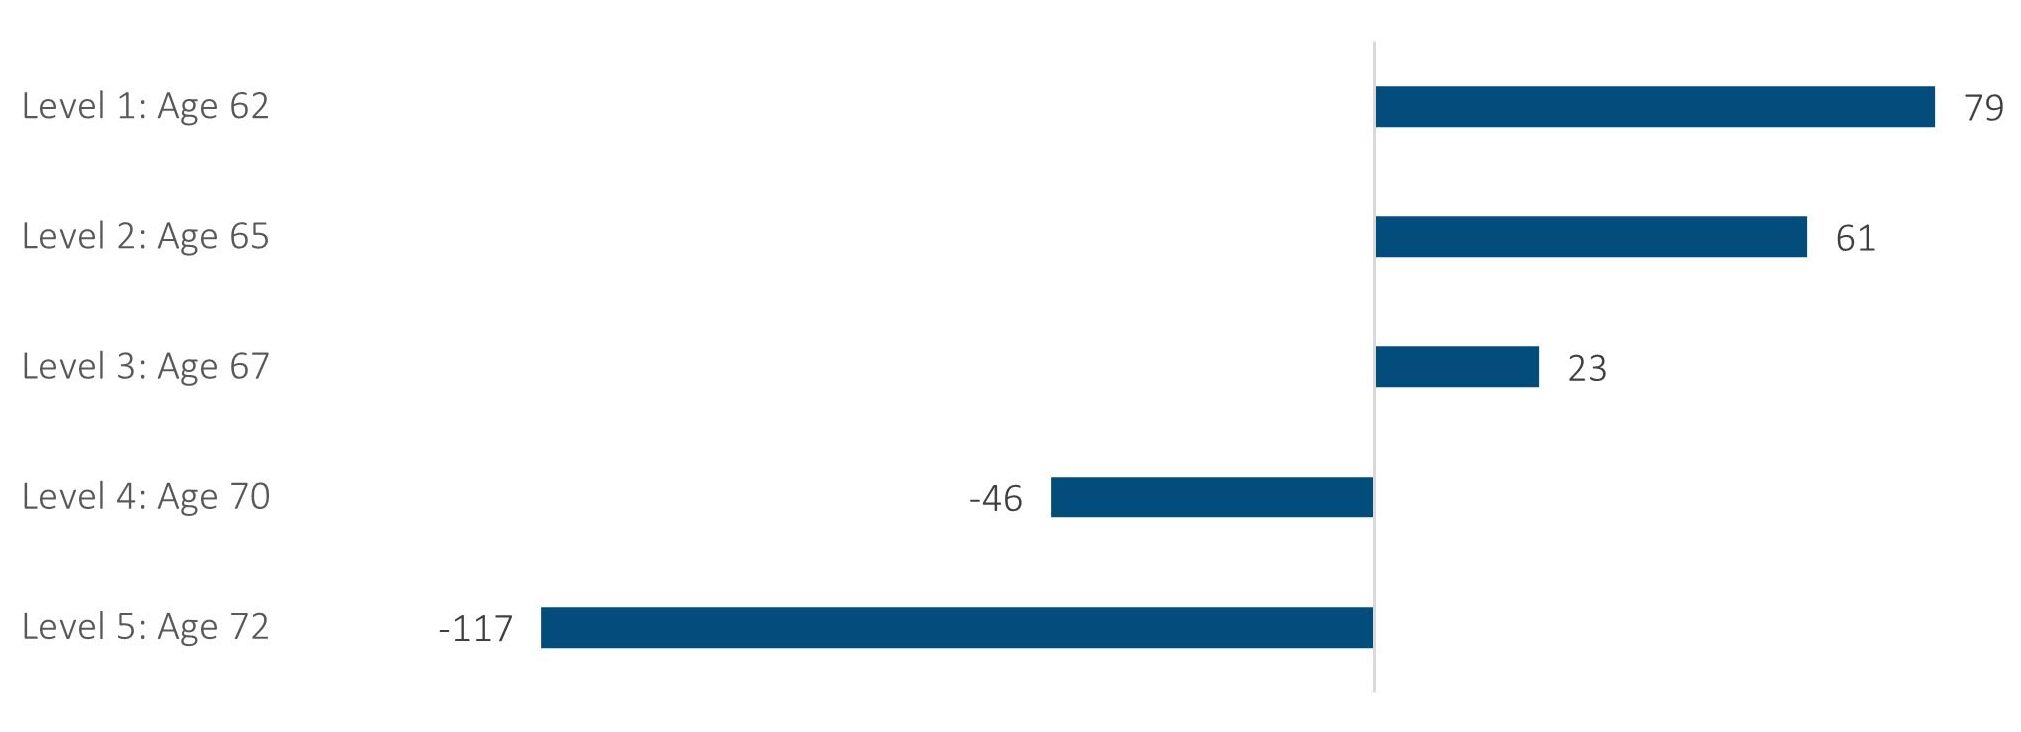
The research also found that 62% of respondents preferred partial retirement before stopping work completely over immediate, full retirement, as shown in Figure 4.
Figure 4: Full vs. Partial Retirement (Actively Working Respondents)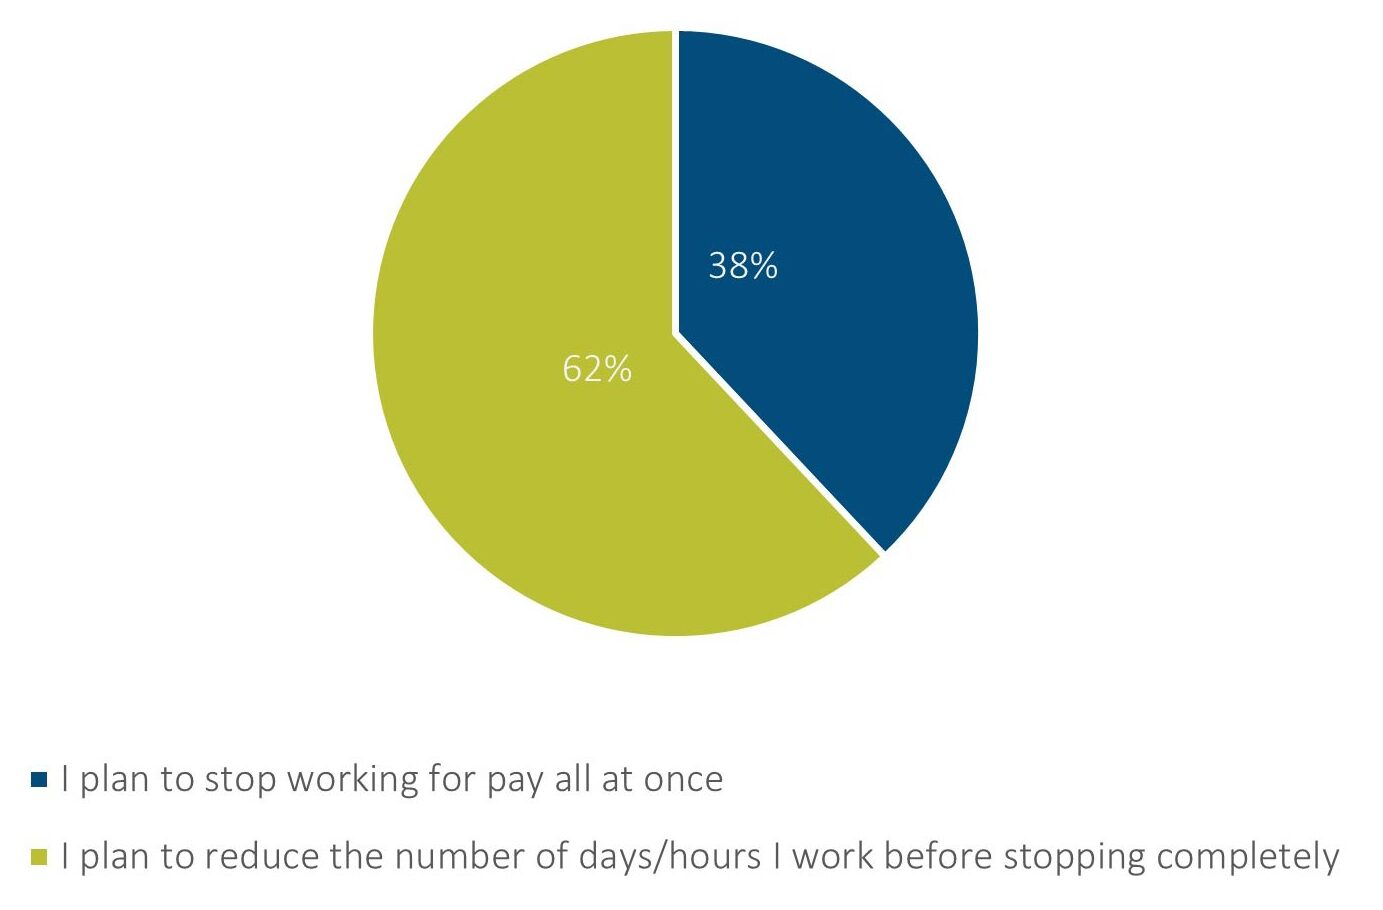
Employer Opportunity
Stated simply, employees do not want to work forever. The sooner they can retire, the better in their view. If employees feel like they will need to work longer, dissatisfaction increases and gets more pronounced past age 67. Using multiple tactics to increase retirement benefits and increase confidence in earlier retirement may improve employee satisfaction. Additionally, because many employees would rather work additional years at reduced hours and ease into full retirement, employers could use this knowledge as a way to improve future labor shortages.
Limitations on Retirement Payments
The survey and conjoint analysis also tested preferences for guaranteed time frames of retirement benefit payments. As Figure 5 shows, respondents’ strongest preference is for retirement payments that stop at the time of their death or 20 years after they retire, whichever occurs later. Because this is the most generous offer, the preference intensity is unsurprising. Interestingly, the option of payments that stop 20 years after retirement (irrespective of the time of death) has the second strongest preference, with a higher utility score (17) than a lifetime payment with no guarantee period (-4).
Figure 5: Average Conjoint Utility Scores: Limitation on the Number of Retirement Payments Received During Retirement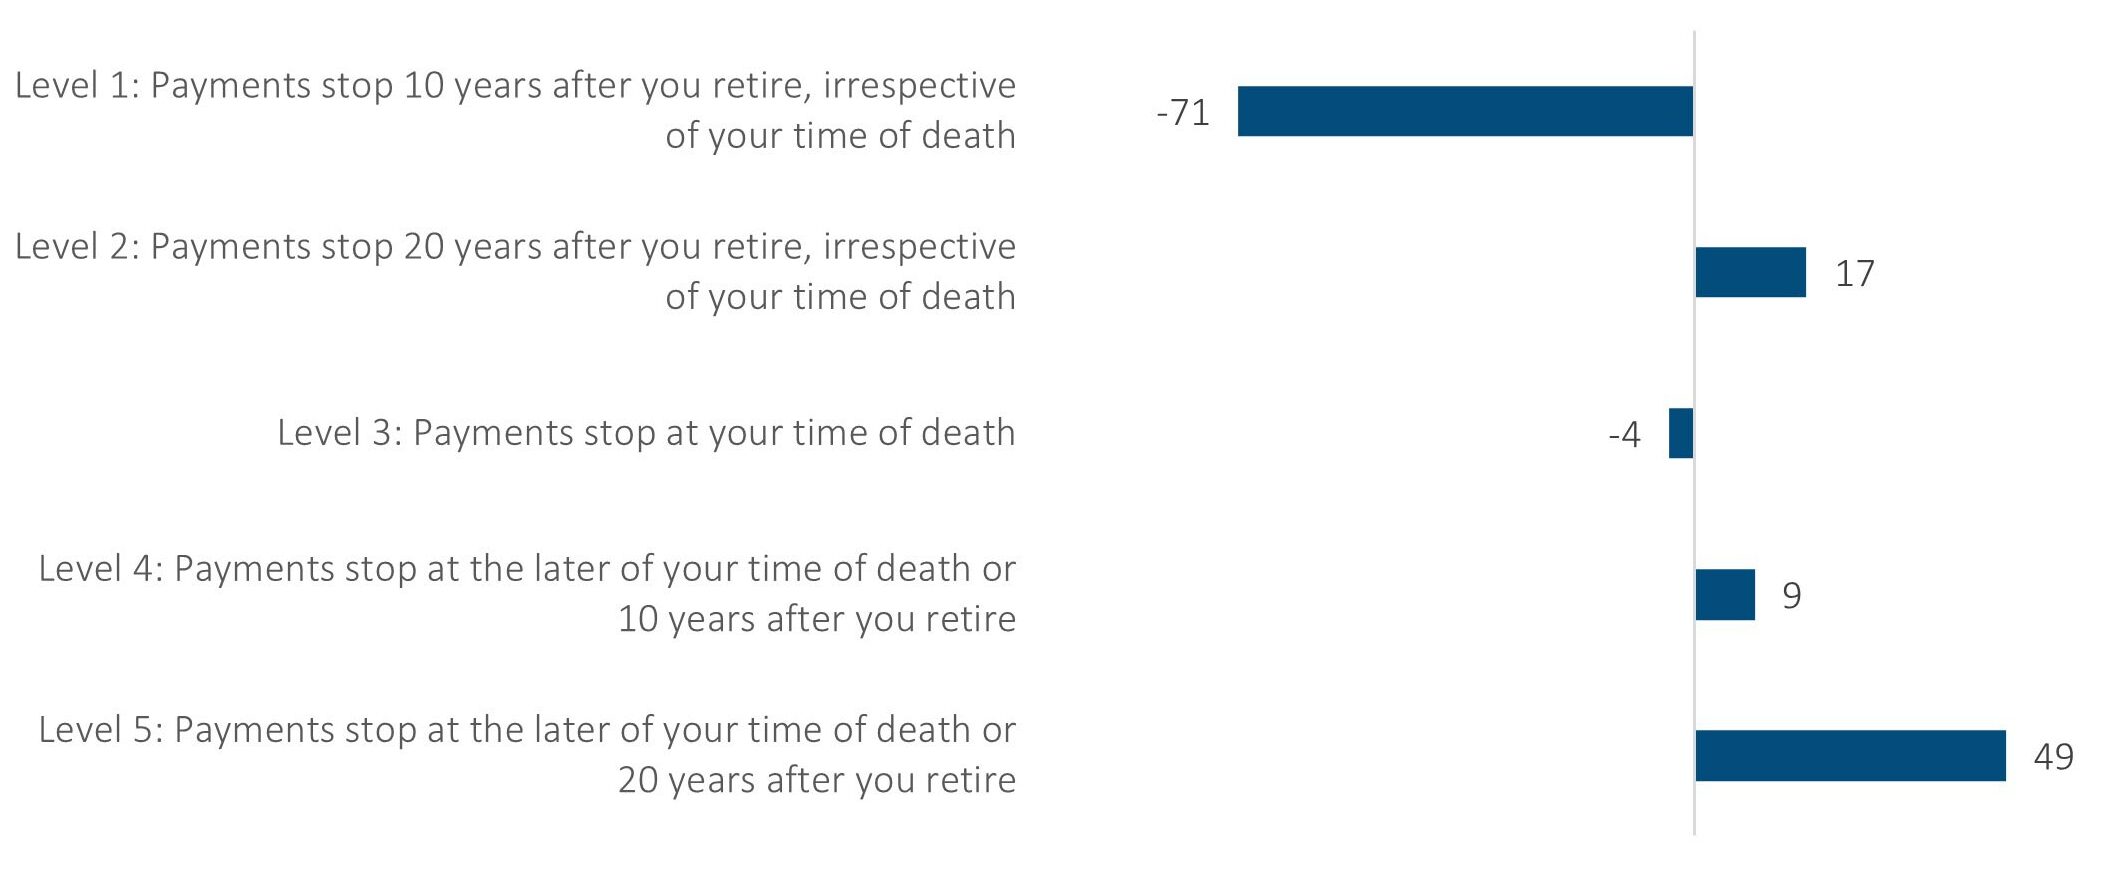
Employer Opportunity
Retirement payment time frame options reveal a preference for benefits that are not forfeitable upon death or are available for bequests to loved ones. Employers that offer such retirement benefits, possibly including annuities in defined contribution plans, may be able to positively influence employee satisfaction.
Conclusion
The data shown in this article is based on the full population studied. Various groups within the total population may have different preferences and utility scores. It’s important that employers assessing the potential impact of changes understand the preferences of different groups within their workforce.
As employers face the challenge of hiring and retaining workers, benefits packages like retirement plans will continue to play a vital role. Uncovering the compromise areas where employee preferences and employer costs meet, including analyzing the needs of subpopulations, is vital in identifying the best possible solutions.
Find your company’s sweet spot, where cost tolerances and employee satisfaction meet, by trying the SOA Research Institute’s Choice Simulator Tool.
Statements of fact and opinions expressed herein are those of the individual authors and are not necessarily those of the Society of Actuaries or the respective authors’ employers.
Copyright © 2023 by the Society of Actuaries, Chicago, Illinois.