Insights: Cat Modeling
The origin and development of a standard for understanding risk
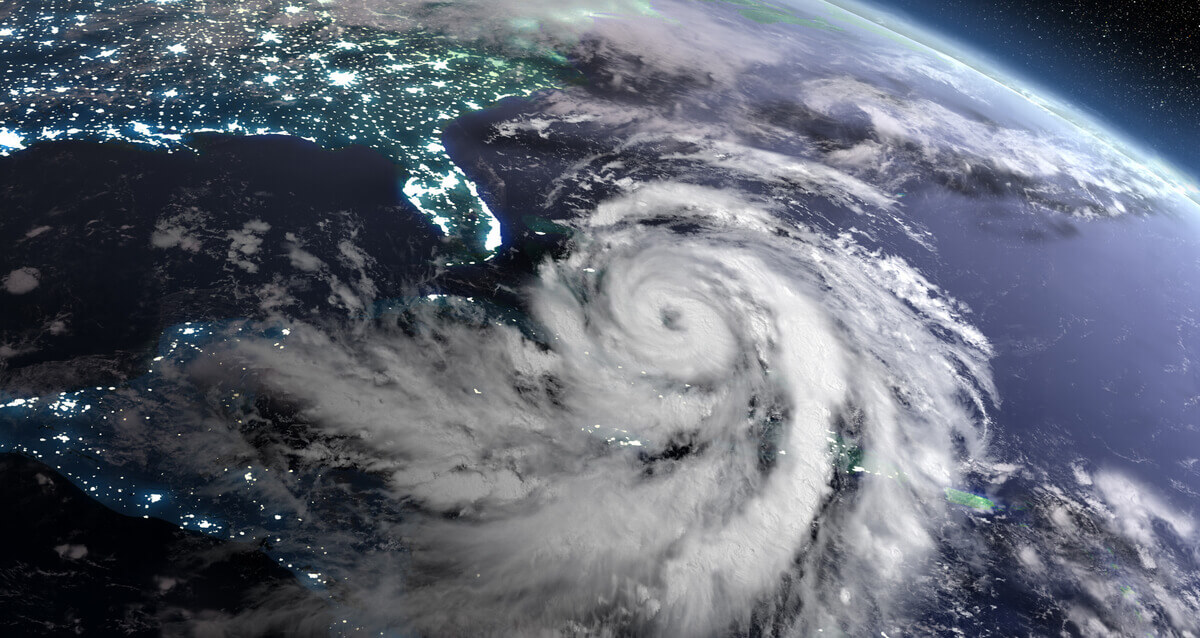
August 2025Photo: Adobe
In the wee morning hours of August 24, 1992, Hurricane Andrew came calling just north of Homestead, Florida. With sustained winds of 165 mph, it would be the strongest hurricane to hit the United States in nearly 60 years. The loss of life was thankfully relatively low. The property damage and the impact on the insurance industry were another matter. Typical maximum reserves for such damage were on the order of $8 billion, twice the largest ever US insured loss to that date (delivered from Hurricane Hugo three years earlier). But, even that very generous reserve fell short of what would ultimately be needed. As a result of the industry shortfall, nearly a dozen insurance companies would soon become insolvent.
More than 1,000 miles from the scene of destruction, in a small office in downtown Boston, AIR Worldwide, a relatively unknown risk modeling company, was working on its estimate of the damage. Within a few days of the disaster, AIR Worldwide would release its estimate.
The AIR estimate of $13 billion (insured loss) came well before claims adjusters’ final tallies. Although the figure was enormous and hard to believe, it helped mobilize necessary aid, even if there was some skepticism. As reality set in, that skepticism turned to intrigue. The actual insured loss estimate for damages from Hurricane Andrew was in the neighborhood of $16 billion. Simple rules of thumb that insurers used for estimating loss from catastrophic events, e.g., take the largest historical loss and double it, had met their match. The cat modeling industry was born.
Cat models are now an integral tool for actuaries to estimate risk. Key features of a cat model are its ability to indicate ranges of damage or loss at specific locations or across entire regions and various exceedance probability losses. Cat models are used primarily by the insurance industry but also by banks, investment firms and governments.
Modules
Three modules typically make up a cat model—hazard, vulnerability, and financial. An advantage of a cat model over simple rules of thumb is contained within the hazard module. The hazard module estimates all possible events that could occur in the near future and the specific event characteristics at building-level locations. The hazard module itself contains two subcomponents.
One subcomponent is a catalog of events, or years of events, of possible activity, all of which could occur in the immediate future. The possibilities are based on more than just history. Ideally, they are also based on output from physics-based models reflecting situations that have not yet occurred but are physically possible. The physics models can be run under various climate conditions to generate possible extreme event scenarios.
The second subcomponent is an intensity module that creates a detailed view of the hazard for each event in the catalog. The view may consist of surface hourly maximum wind speeds at building-level resolution. The actual intensity variable or variables are specific to the model. For a hail model, the intensity could be the kinetic energy of a hailstone and the density and distribution of hail sizes. For a wildfire model, it could be flame length. For a flood model, it could be water depth and current speed.
The second module is the vulnerability module. Its function is to convert the intensity information for each event and every location into a damage number or fraction. Because buildings respond differently for a given hazard intensity (e.g., because of materials), a given catastrophe model can literally have tens of thousands of damage functions. This is based on:
- how many different construction types are supported (brick, light steel, concrete, wood, vinyl, etc.)
- occupancy types (residential, commercial, industrial, etc.)
- modifiers (e.g., how well building codes are adhered to, when the building was built, how many stories, how many windows, is it shuttered, etc.)
In addition to calculating deterministically a fractional damage for each property (mean damage ratio), a range of uncertainty is modeled. The same building may behave differently given the same windspeed but with slightly different scenarios, for example, when a roof tile breaks loose from an adjacent building and shatters a nearby window, thereby breaching the building envelope and causing considerably more damage.
The third module is the financial model. This module converts the percent damage to a monetary value. The percent damage can be that to buildings and contents but also to illness, time lost from work, business interruption (e.g., from power outages and broken links in supply chain), death, and event information lost or liability lawsuits. Thus, the calculation of loss involves other aspects including insurance policy conditions such as deductibles, limits and attachment layers. Additionally, to determine possible ranges and the likelihoods at which they may occur, losses across regions are typically convolved, which is to say that there are many ways to arrive at a one-percent exceedance probability loss.
Uncertainties
Challenges in building cat models revolve around quantifying epistemic and aleatory uncertainty. Epistemic uncertainty results from an incomplete or inaccurate scientific understanding of the underlying process and a lack of data on the process to make statistically unbiased estimates of future outcomes. Aleatory uncertainty stems from the phenomenon’s intrinsic randomness.
Epistemic uncertainty can be reduced by a better understanding of the phenomenon—from better (physical) models, better observations, or both. Aleatory uncertainty is more difficult to reduce. One may know that, on average, two hurricanes will make landfall in the U.S. in a given year (an example of low epistemic uncertainty). But one may not know exactly how many will occur in a particular year, where they will occur, with what intensity or when during the season they will occur—all examples of high aleatory uncertainty.
The ability to physically model a phenomenon accurately can go a long way towards reducing epistemic uncertainty and, in my opinion, can be as important, if not more so, than access to observations of actual events. Observations can be incomplete and contaminated (although it is true that models can also be wrong or biased). But cat models of geophysical phenomena have an advantage as there are equations of motion (for example, for hurricanes, winter storms, floods and even earthquakes) that allow detailed, physically based models to explore all possible scenarios and outcomes.
When it comes to terrorism, liability lawsuits or disease spread, the challenge is greater because such phenomena are more governed by “equations of notion” (how people think and behave rather than physical laws). How people think, act and make decisions influences outcomes just as much as any physical processes.
FOR MORE INFORMATION
- Focus on Terminology – Models. Published by The Actuary in early 2025.
- Growing Life and Health Insurance Industry Risks from Catastrophic Events. This August 2024 report from the Society of Actuaries (SOA) Research Institute discusses growing risks from catastrophic events and how to model these risks.
- The SOA Research Institute’s “Actuarial Weather Extremes” report series identifies and examines weather extremes in North America.
As reports show, machine learning (ML) is playing an increasingly prominent role in developing cat models. From helping to create better hazard catalogs of events, to helping identify relationships between intensity and damage patterns, to understanding the nuances of relationships between actual damage and reported claims, ML is moving the cat modeling needle forward.
I believe actuaries can look for the next generation of models to be able to ingest a collection of geo-referenced photographs of buildings as input and yield potential loss estimates and insurance premium information. Or look for the next generation of weather models to yield, in real time, forecasted loss estimates by county (with uncertainty bounds) as part of a typical numerical weather prediction (NWP) model output.
Statements of fact and opinions expressed herein are those of the individual authors and are not necessarily those of the Society of Actuaries or the respective authors’ employers.
Copyright © 2025 by the Society of Actuaries, Chicago, Illinois.