
A Review of Emerging Data
The long-term sustainability question for the ACA marketplace
Web ExclusiveWith the tremendous interest in the Affordable Care Act (ACA) marketplace, many policymakers and the media have looked for the early signs of its success or failure with everything from emerging demographic information, proposed rate increases, and operational performance on the marketplace website. While these analyses used the best available data, the emerging information did not adequately account for the most important policy question—whether the existing program could produce a long-term sustainable program. Instead, this information only accounts for the performance of a policy during a transitional period, when health plans had limited data and the expectation of financial protection provided under the risk corridor program.
Using information from public sources and the research report in this edition, “An Examination of Relative Risk in the ACA Individual Market” by Rebecca Owen, FSA, MAAA, this article will attempt to answer the sustainability question with newly available data. This question will be addressed according to three criteria important to the sustainability of an insurance market and represent core activities for any insurance organization—the ability to estimate health care costs, the opportunity to make important operational changes in response to an organization’s financial performance, and a program’s incentive to manage the long-term health of its members.
Predicting Claims Cost
The ability to accurately estimate the prospective claims cost for a population is critical to the long-term success of an insurance product. Without a reasonable degree of prediction accuracy, a program’s success will largely be driven by random chance rather than the difficult work of reducing health care costs and improving the quality of care. Ultimately, this uncertainty has the potential to make the market less attractive and produce less overall competition.
In the context of ensuring the long-term sustainability of the program, the question becomes: Does the new ACA marketplace create an environment in which prospective claims cost can be accurately predicted?
This question is important because the ACA marketplace program has introduced a new rate development process that requires insurers to estimate rates that are supported by the statewide risk pool rather than the unique and distinct experience of each health plan separately (a methodology used in other lines of business). This market-level estimate is required because the risk adjustment program reallocates premium dollars to health plans that receive a disproportionate percentage of sicker members from health plans that have relatively healthy members. As a result, even if a health plan had a relatively healthy population, it needs to account for the entire risk pool because a premium rate sufficient for its population would not account for a risk adjustment payment to health plans with sicker members.
This policy has the intended effect of providing financial protection for those health plans that receive a disproportionate percentage of sicker members; however, it also introduces new challenges in the rating process. In particular, the ACA rating structure requires insurers to estimate the statewide risk pool and the associated risk adjustment payments with dated marketwide information. The information available for the most recent filing for calendar year 2017 highlights the challenge:
- 2014 marketwide risk pool information and health plan specific risk adjustment payments. In some states, an actuarial consulting firm was able to estimate the 2015 risk pool and risk adjustment payments based on data voluntarily submitted by health plans. In addition, in some states, the revised risk adjustment information could be incorporated into the 2017 rates.
- Health plan specific claims information from 2014 up to the filing date. Without a comparable relationship to the risk of other health plans, however, the data in the more recent period (2015 and 2016) has limited predictive value because the corresponding risk adjustment payment cannot be calculated without relative risk scores from other health plans. In addition, this lack of information could be magnified further if a particular health plan represents a small fraction of the overall statewide market.
- Standard information used to develop health plan specific trend rates including provider contract information and utilization trends. Using this information, actuaries are tasked with developing a premium rates for 2017 that are based largely on 2014 market level data and health plan specific information through the filing period. Needless to say, if the risk pool changes significantly from 2014 to 2017, the underlying premium rate could differ significantly from original estimates.
Taken in total, the importance of the statewide risk pool in developing health plan specific risk adjustment payments and lack of data implicitly make a stable risk pool important in developing accurate rates. The most recent information released on the marketplace provides an early indicator of the stability of the risk pools.
Emerging Data: Percentage Changes in Risk Adjustment Scores — Population Weighted1
As highlighted in Figures 1, 2, and 3, developed by Owen, the percentage changes in the statewide risk pools are significant—with each figure highlighting a different component of the volatility.
- Figure 1. This table highlights the aggregate change in the national marketplace risk pool as well as the states with the most impactful change. While the overall average (5.2 percent) may not appear significant, this change is still significant when one considers the magnitude of the marketplace population. In addition, the states with the most impactful change (−17.42 percent and +11.85 percent) have changes that would make any prospective estimates of the risk pool extremely difficult.
| Figure 1: Risk Score Changes Over Time | |||
|---|---|---|---|
| State Risk Information | 2015 | 2014 | Percentage Change |
| Average risk score | 2.31 | 2.20 | 5.20% |
| Largest increase (Alabama) | 2.69 | 2.29 | +17.42% |
| Largest decrease (Nevada) | 2.24 | 2.45 | −8.40% |
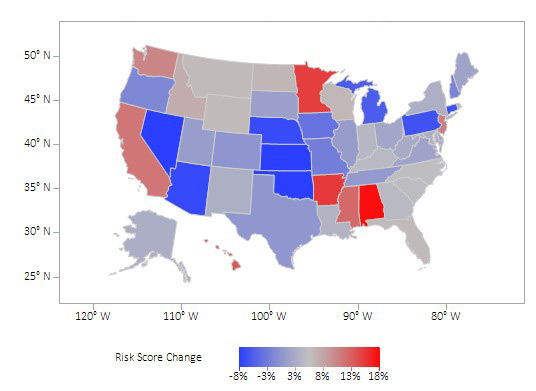
- Figure 2. The color-coded map highlights the risk adjustment change across several states with the darker colors representing the states with the most significant volatility.
Figure 2: Risk Score Change by State
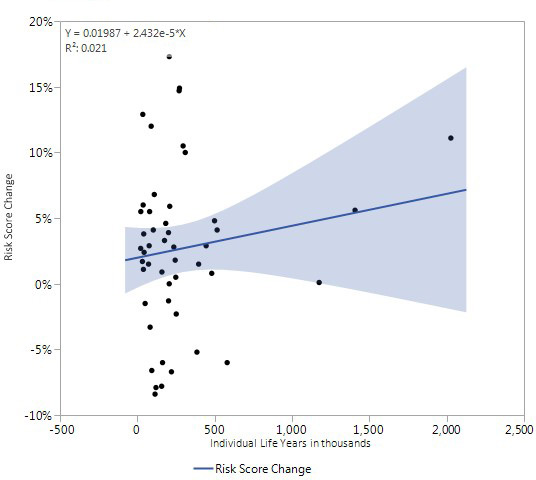
- Figure 3. This table highlights state specific volatility by marketplace population. As suggested in the graph, this volatility across several states is significant. While one might expect large swings in relatively smaller states, the magnitude of the change in larger states was particularly surprising. For example, the largest state in overall population and marketplace membership, saw an enormous change in the aggregate risk score (+11.1 percent) that has the potential to impact prospective health care estimates. In addition, these percentage changes are particularly high when compared to other lines of business where changes can be expected to rarely exceed a few percentage points a year.
Figure 3: Risk Score Change Relative to Marketplace Population Size
In short, the magnitude of the state risk pool changes between 2014 and 2015 suggest that prospectively predicting health plan specific risk adjustment payments could be difficult and have an effect on the overall accuracy of the rates in the market.
While this information describes the volatility between 2014 and 2015, this uncertainty will likely continue. The statewide risk pools could be affected by several other factors including changing participation rates caused by a higher tax associated with the individual mandate, the migration of individuals currently on the transitional plans to the marketplace, and the potential for the disenrollment of the young and healthy as rates are increased to account for the elimination of two of the risk protection programs and poor historical performance.
Beyond the challenges in estimating health care costs, the ACA marketplace has features that can make inaccurate health care estimates particularly costly.
- Minimum medical loss ratio. Under the loss ratio floor, health plans will face unlimited downside with a financial upside that is limited by the minimum medical loss ratio floor. As a result, while losses could be unlimited, an upside associated with a randomly profitable year will be limited.
- Structure of the subsidy program. As highlighted later in this article, a slightly lower premium relative to other competitors could produce substantial net premium differences for subsidized members that could result in significant enrollment increases for lower priced health plan products. As a result, an inadequate premium has the potential to be magnified with large enrollment increases.
- Health plans exiting the market. As seen in several markets, some health plans are either exiting the market completely or ceasing operation (e.g., co-ops). In addition to disrupting many members, this will also increase the membership and potential risk for the remaining health plans.
While one can debate the magnitude of the uncertainty in the ACA marketplace, it clearly has greater uncertainty than other lines of business where the historical experience of the relevant population is complete and the rate development process is not dependent on statewide risk pool information that is several years old. The recently released information from the Centers for Medicare & Medicaid Services (CMS) simply reinforces this concern—the large changes in the underlying statewide risk pools suggest that prospective estimates will be subject to significant uncertainty.
Financial and Operational Performance Timing
Financial performance is important. Financial performance provides an organization with the necessary information to make adjustments to its operational performance to ensure the long-term sustainability of an organization. Without this feedback, important operational deficiencies have the potential to continue without the necessary improvements required to ensure the long-term viability of a product line. Taken in the context of an insurance organization, this feedback is important to ensure that a wide range of important activities are operating at a high level including medical management, claims payment, provider contracting, and pricing.
Unlike other product lines, the structure of the ACA marketplace significantly delays the timing of the true performance of the product. As designed, the true impact of the ACA exchange revenue payments are not known until the risk level is compared with other plans and then reported in the middle of the following calendar year (June 30, 2016 for the final invoice with the final settlements made later). In this final reconciliation, the risk scores are compared among the plans and payments are either made or received among the health plans depending on the relative risk attracted to each health plan.
This delay occurs because the model is based on the diagnosis information within the policy year rather than from the prior period. While this approach provides a theoretically more accurate approach to adjusting premium, this mechanism does not allow health plans to have information on their own risk scores until their experience matures throughout the plan year.
Moreover, this delay in receiving information on the true financial performance of the product line is unique to the ACA marketplace and not a feature in the large group segment, the small and individual segment prior to ACA, or Medicare Advantage. In these segments, the revenue and emerging health care costs can be estimated and provide important guidance for operational improvement.
- Large group/pre-ACA and individual. The revenue is based on the contract terms agreed upon prior to the beginning of the contract year and the claims used to develop the premium are only dependent on the costs unique to a particular health plan. Unlike the ACA marketplace policy, these lines of business do not require a final reconciliation to determine the financial performance within a contract year.
- Medicare Advantage. The revenue can be predicted accurately based on the historical performance of the risk adjustment program (see sidebar on the Medicare Advantage risk adjustment program). Similar to other lines of business, the claims costs are based on the claims experience unique to each health plan and the financial impact can be estimated throughout the year.
As suggested, the ACA risk adjustment delay creates an additional level of uncertainty in managing the business and making operational improvements. Of course, this could be managed more easily if the risk adjustment payments are modest.
The emerging data on the extent of the risk adjustment payment provides evidence of this volatility.
Emerging Data: The Absolute Value of the Transfer Payments are Large Relative to Most Pricing Assumptions2
As reported by the CMS for the 2014 and 2015 contract years, the absolute value of the average transfer amount as a percentage of premium was 10 percent in the individual market and 6 percent in the small group market. While this represents an average transfer amount, this amount can vary widely and will likely have a wider variance for smaller insurers who have a smaller percentage of overall market share. The June 30, 2016 CMS report provided some insight into this variability by showing the net risk adjustment as a percentage of premium for insurance companies with membership of different size (Figure 4).
| Figure 4: Net Risk Adjustment as a Percentage of Premium | |||
|---|---|---|---|
| Percentile Range | Less than 12,000 Member Months | 12,000 to 120,000 Member Months | Greater than 120,000 Member Months |
| 25th percentile | 35% | 21% | 8% |
| 50th percentile | 1% | 3% | −2% |
| 75th percentile | −36% | −10% | −12% |
Relative to most pricing and premium assumptions where a few percentage points are meaningful, these adjustments are significant and can represent the difference between a successful or unsuccessful year for a health plan.
This volatility highlights the challenge with the ACA marketplace policy. While the program is structured to delay the final reconciliation of risk adjustment, this delay becomes even more challenging given the magnitude of the adjustment. This policy also has the effect of delaying an important feedback loop between financial performance and operational improvement—particularly given the two year lead time before changes can be made.
Medical Management and Member Turnover
Beyond paying claims and organizing the health care delivery system, an important health plan function is to reduce costs and improve quality through a wide range of medical management activities. These programs contribute to the success of any managed care program and have been particularly effective with sicker populations that have more extensive health care needs—including Medicare Advantage and Medicaid populations. These programs are successful, in large part, because members with more extensive health care needs are more likely to develop a long-term relationship with their health plan. This continuity helps ensure that members maintain care in a single organized program and provides a financial incentive for health plans to invest in the long-term health of their members.
The structure of the ACA marketplace, however, has the potential to encourage member turnover. The following example from a Milliman briefing paper, “The Proposed Federal Exchange Auto-Enrollment Process: Implications for Consumers and Insurers,” by Susan Pantely and Paul Houchens, highlights the potential for this effect. (These comments have been reprinted from other ACA articles.)3
In Figure 5, the authors highlight the premium and subsidy level offered to an exchange participant at 150 percent of the federal poverty limit. Consistent with ACA policy, the subsidy level in this example is based on the second-lowest silver plan premium—in this case, the maximum expenditure individual is 4 percent of a household’s income or $57. The resulting subsidy amount ($268) can then be applied to all the plans to produce a higher or lower net premium.
| Figure 5: Year 1 Example of Subsidy Levels | |||
|---|---|---|---|
| ACA Component | Plan 1 | Plan 2 | Plan 3 |
| Full premium | $300 | $325 | $350 |
| Subsidy amount (based on the second-lowest silver plan) | $268 | $268 | $268 |
| Monthly net premium | $32 | $57 | $82 |
| Percentage of income | 2.2% | 4.0% | 5.7% |
As highlighted in Figure 5, a significant percentage differential in actual net premium levels—$32 compared to $57 and $82—could prompt an individual with an income level slightly above the federal poverty limit to choose the lowest-cost plan.
This switching could be magnified over time as some health plans change premium rates to increase market share. The authors highlighted the following example (Figure 6) in which Plan 3 purposely reduced its premium and Plan 2 maintained its initial rate in an effort to increase market share.
| Figure 6: Year 2 Example of Subsidy Structure | |||
|---|---|---|---|
| ACA Component | Plan 1 | Plan 2 | Plan 3 |
| Full premium | $320 | $325 | $290 |
| Percentage change from 2014 | 7% | 0% | −16% |
| Subsidy amount (based on the second-lowest silver plan) | $263 | $263 | $263 |
| 2015 Net premium | $57 | $62 | $32 |
| 2014 Monthly net premium | $32 | $57 | $82 |
| Percentage net premium change from 2014 | 78% | 9.0% | −61% |
In this case, a member in Plan 1 where the health plan proposed a modest 7 percent increase would still see a large net premium change caused by two factors—an increase in the premium by 7 percent and a reduction in the subsidy caused by a reduction in the second lowest silver plan ($325 to $320). Because the member would see the entire burden of the rate increase and the reduced subsidy, the incentive to switch to a lower cost plan would increase significantly.
As the marketplace experience becomes available, the theoretical discussion can now be supported with quantifiable metrics.
Emerging Experience–Member Turnover
As reported by CMS, 43 percent of enrollees on the marketplace exchange switched plans with 64 percent of the switchers moving to a new health plan on the marketplace.4 As a result, among those who were enrolled in a plan in both 2015 and 2016, 73 percent remained enrolled in the same health plan. If one also considers those members who left the program between 2015 and 2016 (14 percent) under the most optimistic scenario, the overall retention rate for the average health plan was 62 percent.5
By almost any measure, this member turnover in the ACA marketplace program has been significant relative to other lines of business. While an argument could be offered that this competition helps ensure that health plans with lower premiums receive the bulk of the enrollment, it also limits the long-term advantage of having members enrolled in a well-resourced medical management program.
Conclusion
Health plans exist to provide important services to ensure that members receive high quality care in the most efficient manner possible. In accomplishing this, they provide medical management services, contract with providers, pay claims, and manage relationships with members. These are important activities and health plans have been largely successful in several lines of business including large group, Medicare and Medicaid.
As actuaries, our job is to help ensure that we have a financially viable environment that allows insurers to meet the many financial and administrative commitments that we make to our members. We can best accomplish this goal when the policy structure allows health care costs to be reasonably estimated, when we can track financial results and make operational improvements, and when we can ensure reasonable investments in our medical management programs.
The emerging evidence on the ACA marketplace suggests that we will have significant challenges in meeting these goals:
- The statewide risk pool variability between 2014 and 2015 suggests that prospective estimates of the risk pool and associated risk adjustment payments will be subject to significant uncertainty.
- The delay in estimating the risk adjustment payment and its magnitude (10 percent of premium in the individual market with many insurers having far more significant transfers) suggest that tracking results and connecting financial results to operational results will be difficult.
- The substantial annual member turnover (38 percent) limits the opportunity for health plans to make the investments necessary to improve the health of its members.
While the final analysis on the ACA marketplace policy is hardly complete, we should consider this emerging evidence as policy improvements are developed. No matter one’s view of the program, we can all agree that we should aspire to create a program that ensures health care costs can be accurately predicted, financial results can be used to improve insurance operations, and health plans have an incentive to provide medical management services. Without meeting these goals, the ACA marketplace will likely prove to be much less successful than the Medicare Advantage and the managed Medicare programs.
Medicare Advantage Risk Adjustment Background (reprinted) 6
The Medicare Advantage program has implemented risk adjustment mechanisms that have been largely successful in adjusting revenue to account for populations that differ from the average. While the extent of the adjustment and the specific technical details have been debated, most people would agree that the underlying structure of providing risk adjustment payments has been successful in adjusting revenue for health plans based on their unique population. These risk adjustment programs have also proven that a well-designed risk adjustment program can be effective in the absence of medical underwriting.
As the program has evolved over several years, the Medicare risk adjustment program has developed features that have allowed health plans to have visibility into the expected revenue associated with the risk adjustment program. The specific features include:
Prospective Risk Score Methodology. The Medicare program uses the Hierarchical Condition Category (HCCs) risk adjustment methodology with historical diagnosis information as the basis to adjust premium revenue for the next calendar year. Although the mechanics of the development are somewhat complicated, the broad intent is to ensure that the risk score for an individual is properly calibrated against a fee for service population using historical data to adjust prospective rates. Because the risk scores are based on historical data and a published methodology, the health plans can have a reasonably accurate picture of their revenue for the upcoming year. In addition, as highlighted in the discussion on the ACA marketplace, this methodology does not require a comparison with other health plan risk scores in order to determine a revenue impact.
Risk Score Adjustments to Revenue. Health plans in the Medicare program receive an immediate risk score for each enrollee at the beginning of the plan year. This initial risk score is then updated with two additional reviews that allow updated data and additional run out from the historical experience period. The following schedule highlights the risk analysis for the calendar year 2014:
| Risk Score Basis | Applicable Payment Period | Historical Experience Basis for the Risk Score Development |
| Initial risk score | 1/1/2014–7/1/2014 | 7/1/12–7/1/13 |
| Mid-year adjustment—initial risk score adjusted and the risk score adjusted for the remainder of the calendar year | 1/1/2014–7/1/2014 (Retrospectively adjusted) 7/1/2014–12/31/204 (Adjusted to account for new information) |
1/1/2013–12/31/2013 with paid claims through 3/15/2014 |
| Final adjustment | 1/1/2014–12/31/2014 | 1/1/2013–12/31/2013 with paid claims through 1/31/2015 |
Consistency of Risk Scores. The risk scores are also likely to be relatively consistent from one year to the next because a health plan’s Medicare population is not likely to undergo substantial change from one year to the next—relative to other populations, seniors are much less likely to move from one plan to another. In addition to ensuring a bid consistent with the underlying risk and revenue of the population, this consistency also helps the health plan ensure adequate medical management support and allow for accurate budget estimates.
The net of effect of these features is a risk adjustment program that is known in advance of developing the Medicare bid and a revenue stream that can be predicted with some certainty after the open enrollment period. Most importantly, this program creates a feedback loop that ensures a health plan can make changes in the operations—including contracting or medical management activities—that could influence both the quality of care and financial results.
References:
- 1. Owen, Rebecca. “An Examination of Relative Risk in the ACA Individual Market, Society of Actuaries,” 2016. ↩
- 2. “Summary Report on Transitional Reinsurance Payments and Permanent Risk Adjustment Transfers for the 2015 Benefit Year,” Released June 30, 2016. “Summary Report on Transitional Reinsurance Payments and Permanent Risk Adjustment Transfers for the 2014 Benefit Year,” Released June 30, 2015. ↩
- 3. Wrobel, Kurt. “The ACA Exchange and Medicare Part D: A Comparison of Financial Risk,” Health Watch, 2014. ↩
- 4. ASPE Issue Brief, “Health Insurance Marketplaces 2016 Open Enrollment Period: Final Enrollment Report.” March 11, 2016. ↩
- 5. Ibid. ↩
- 6. Supra note 3. ↩