
Turning up the Heat
Understanding the risks and potential implications of a changing climate
December 2017/January 2018Hello. My name is Ronora Stryker, and I am a weather addict.
In the morning as I get ready for work and before I go to bed each night, I tune in to the local news and watch the latest forecast. I also monitor the local weather radar throughout the day and have severe weather alerts on my phone. If there is a threat of severe or extreme weather, I turn to The Weather Channel 24/7 until the threat dissipates. During this heightened threat level, I am interested in knowing what the various computer models are showing. Forecasting the weather is difficult. We all know there are times when the forecasts are wrong and the actual weather and/or severity is much different than predicted. I seek out different forecasts to look for consistencies because I think the more consistent various forecasts are, the more likely the predicted weather events will occur.
I obsess about the weather because I want to be prepared. Adverse and extreme weather, as well as extreme climate events, are disruptors with varying consequences from being a minor inconvenience to creating catastrophe. On a personal level, I want to develop strategies to protect myself and my family from the associated risks.
From my years of monitoring the weather, it seems the frequency of extreme weather/climate events is increasing. In the 30 years that I have lived near Chicago, there have been at least four rare and damaging flood events, a deadly heat wave, and record cold and snow. Recently, the American Academy of Actuaries (the Academy), the Casualty Actuarial Society (CAS), the Canadian Institute of Actuaries (CIA) and the Society of Actuaries (SOA) launched the Actuaries Climate Index (ACI), which tracks changes in climate extremes for the United States and Canada. Based on data from the government and other neutral sources, the ACI provides an objective resource on climate trends by measuring changes in extreme weather and sea levels. Let’s examine the ACI data to see if the number of extreme weather events is increasing.
Actuaries Climate Index: Overview
The ACI has six components:
- Warm temperatures—the frequency of temperatures above the 90th percentile
- Cold temperatures—the frequency of temperatures below the 10th percentile
- Heavy precipitation—maximum five-day precipitation each month
- Drought—maximum number of consecutive days in a year with less than 1 mm of precipitation
- High wind—the frequency of wind power above the 90th percentile
- Change in sea level
Currently the ACI is limited to the continental United States and Canada. In addition to measuring the entire region, analysis also is provided by country and for 12 subregions. Canada is divided into five regions, while the United States is partitioned into seven regions. The regions are:
Canada—CAN
- CAR—Central Arctic (Northwest Territories and Nunavut)
- NEA—Northeast Atlantic (New Brunswick, Newfoundland and Labrador, Nova Scotia and Prince Edward Island)
- NEF—Northeast Forest (Ontario and Québec)
- NPL—Northern Plains (Alberta, Manitoba and Saskatchewan)
- NWP—Northwest Pacific (British Columbia and Yukon Territory)
United States—USA
- ALA—Alaska
- CEA—Central East Atlantic (Connecticut, Delaware, Massachusetts, Maryland, Maine, New Hampshire, New Jersey, New York, Pennsylvania, Rhode Island, Vermont, Washington, D.C., and West Virginia)
- CWP—Central West Pacific (Washington, Oregon and Idaho)
- MID—Midwest (Iowa, Illinois, Indiana, Michigan, Minnesota, Missouri, Ohio and Wisconsin)
- SEA—Southeast Atlantic (Alabama, Arkansas, Florida, Georgia, Kentucky, Louisiana, Mississippi, North Carolina, South Carolina, Tennessee and Virginia)
- SPL—Southern Plains (Kansas, Montana, North Dakota, Nebraska, Oklahoma, South Dakota, Texas and Wyoming)
- SWP—Southwest Pacific (Arizona, California, Colorado, New Mexico, Nevada and Utah)
The frequency of extreme events measured by the ACI is relative to the average frequencies during the reference period of 1961–1990, with the index values expressed as standardized anomalies—for instance, the difference between the observations in each season/month and its average in the reference period, divided by the standard deviation of the observation in the reference period.
Higher index values indicate an increase in the occurrence of extreme weather events. When the index value is greater than 1, it can be considered outside the bounds of normal variability. The standard deviation of each component during the reference period is equal to 1. Therefore, in the figures within this article, the vertical axis scale of each ACI component is in standard deviations.
Index Trends
Besides monthly and seasonal index values, five-year moving averages are provided to identify trends in the index results. In looking at the most recent temperature results through winter 2017 (available at actuariesclimateindex.org), the five-year moving average warm temperatures values for all of the regions shown in Figure 1 are at least 0.5 standard deviations from the base period mean, with the majority of regions nearing 1.5 standard deviations from the base period mean in 2016 and 2017. This indicates there has been an increase in the frequency of extreme heat compared to the 30-year reference period. This has been very consistent since 2010. The Midwest region is the exception, with results near the base period mean for the recent period.
Figure 1: Five-Year Average Warm Temperatures (Northern Regions)
Five-Year Average Warm Temperatures (Southern Regions)
Source: Actuaries Climate Index
This warming pattern also can be seen in the five-year moving average cool temperatures values. In Figure 2, most regions by 2016 have reached at least –0.5 standard deviations from the base period mean, meaning that there are not as many extreme cold events as in the reference period. The area that shows the lowest drop in the frequency of cooler temperatures is the Midwest region, indicating that this region has not warmed as much as other regions.
Figure 2: Five-Year Average Cool Temperatures (Northern Regions)
Five-Year Average Cool Temperatures (Southern Regions)
Source: Actuaries Climate Index
Sea level is another component for which the ACI shows clear trends (see Figure 3). For the southern regions, sea levels have been increasing relative to the 1961–1990 reference period. However, that is not the case for the northern regions. In looking at the analysis, only the Northeast Atlantic region has an increase in sea level. The ACI also shows a decrease in sea level for Alaska, where the land has been rising to offset the increased volume of sea water.
Figure 3: Five-Year Average Sea Levels (Northern Regions)
Five-Year Average Sea Levels (Southern Regions)
Source: Actuaries Climate Index
For the other weather components, a few regions stand out. However, in general, there are no particular patterns revealed by the ACI for all regions or a group of regions. Figure 4 shows the five-year moving average values for the United States and Canada combined for wind power (W), precipitation (P) and drought (D) components. The frequency of extreme precipitation has been increasing in the last few years. In addition, the drought component values have been on the rise since the late 1990s, but recently have declined. However, there are no clear trends for these components overall.
Figure 4: Wind Power, Precipitation and Drought in the United States and Canada
Source: Actuaries Climate Index
The composite ACI is an average of the six individual components. The cold temperatures component is subtracted in the formula as the decreasing frequency of cool temperature extremes is indicative of general warming, as is the increase of the frequency of warm temperature extremes. Adding the two temperature component values together would have masked the shift to higher temperatures. Figure 5 shows the seasonal standardized anomalies for the ACI along with the five-year moving average trend line steadily increasing. The current five-year moving average value, winter 2017, is the highest value to date at 1.14, and it also falls outside the bounds of normal variability. As we have shown in the figures presented in this article, the main drivers for the increase in the composite ACI—especially in the latter years—are warm temperatures, sea level changes, precipitation and drought.
Figure 5: Actuaries Climate Index—United States and Canada
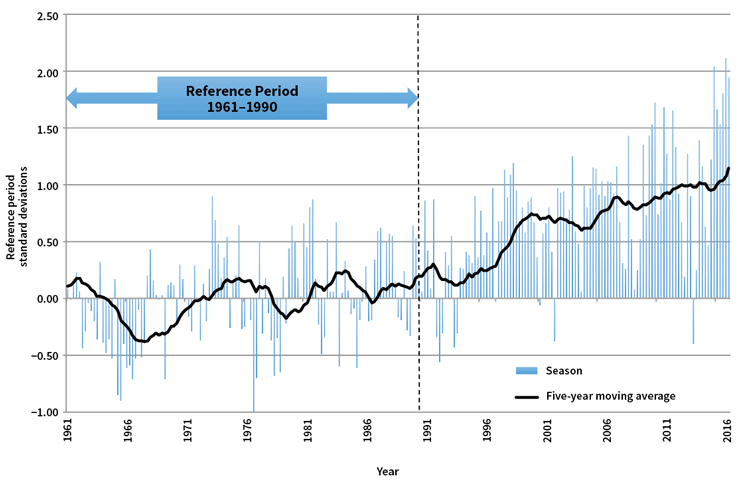
Source: Casualty Actuarial Society
Conclusion
Given the increasing frequency of extreme climate and weather, and the potential for systemic consequences, there is an increasing need for actuaries to quantify, mitigate and manage the associated financial risks for our employers and clients—just like we do for ourselves and our families. The data underlying the ACI graphs are available for download from the ACI website for actuaries and others to perform analysis to help assess risk and provide insights to enhance pricing, product design, underwriting, marketing and claim strategies. There are also sample calculations and a development and design document to provide a better understanding of the ACI and its potential uses.
In addition, the SOA formed a new research committee, the Climate and Environmental Sustainability Research Committee, to produce research that expands the boundaries of the actuarial profession in this emerging area of practice. Included in the committee’s work to date are summary papers of existing sources to help actuaries in measuring, mitigating and managing risks associated with climate, weather and environmental changes. On the horizon are projects that:
- Identify methods actuaries currently are using in practice for considering environmental risks.
- Educate actuaries on integrated assessment models and the social cost of carbon.
- Examine modeling, measuring and pricing flood risk.
So, the next time you watch the weather on the local news, think beyond how to prepare yourself and your family for the next day. I challenge you to think more broadly about how to apply the information as an actuarial professional to protect your friends, employers and clients. An example is analyzing life and health claims data during or after an extreme weather event to investigate the relationship between these events and insured mortality and morbidity. Dig into the models, methods and data that are publicly available and form the framework for the forecasts to enhance your understanding of the risks and potential implications of a changing climate. Become a weather addict!
Special thanks to Caterina Lindman, FSA, FCIA, and Doug Collins, FCAS, MAAA, chairs of the Actuaries Climate Index Working Group, for their assistance with this article, including the use of the graphs.