
Adjustable Rates for Long-Term Medical Insurance: Part 2
Insights into practice and modeling exploration
November 2022Rate-adjustable long-term medical insurance (from now on referred to as “long-term medical”) has been a hot topic in the insurance industry in China, particularly in the last two years. This two-part article series attempts to analyze key risk factors and preliminarily explore the direction of risk management based on the empirical trend and model prediction of long-term medical.
Part 1 of the series introduced the development background of long-term medical, including the history, policy environment and operation status, and described the risk characteristics of long-term medical from the management and market sides, respectively. From the perspective of actuaries, this Part 2 focuses on identifying and analyzing the key risk factors through the loss ratio model and preliminarily discusses the management of long-term medical from the perspectives of product design and operational management.
Risk Analysis of Long-Term Medical: Level 3—Measure Risk as an Actuary
To have a more detailed understanding of long-term medical risk factors and their manifestations, two sets of loss ratio models, before and after the rate adjustment, were used to identify the key risk factors.
Overview of the Loss Ratio Model
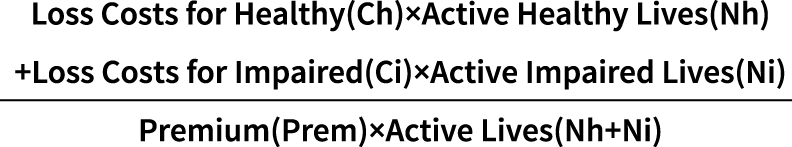
Focusing first on the loss ratio before rate adjustment, the overall loss ratio before rate adjustment (R) can be expressed as a weighting of the healthy individual’s loss ratio and the impaired individual’s loss ratio.
For ease of expression, three variables are introduced:
- A—loss cost multiple of impaired individuals relative to healthy individuals
- B—multiple of the number of healthy individuals relative to the number of impaired individuals
- i—inflation and leverage effect; i.e., divide the ratio of year n loss costs for healthy by first year
By deforming the formula of loss ratio before rate adjustment and introducing these three key variables, the formula of loss ratio in the year before rate adjustment (Rn) is obtained:
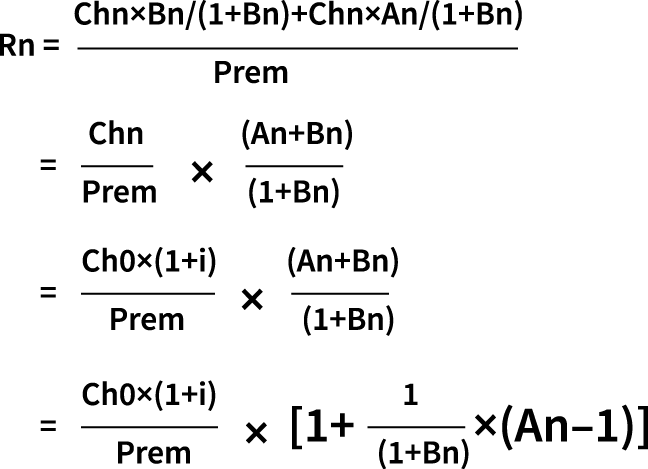
This formula allows for the identification of four key risk factors that affect the loss ratio:
- Initial loss cost
- Inflation and leverage effect
- Percentage of impaired individuals
- Loss cost multiple of impaired individuals
All four of these factors are positively correlated with the loss ratio. Each of these key risk factors is discussed in detail throughout the rest of this article.
Key Risk Factor: Client Screening
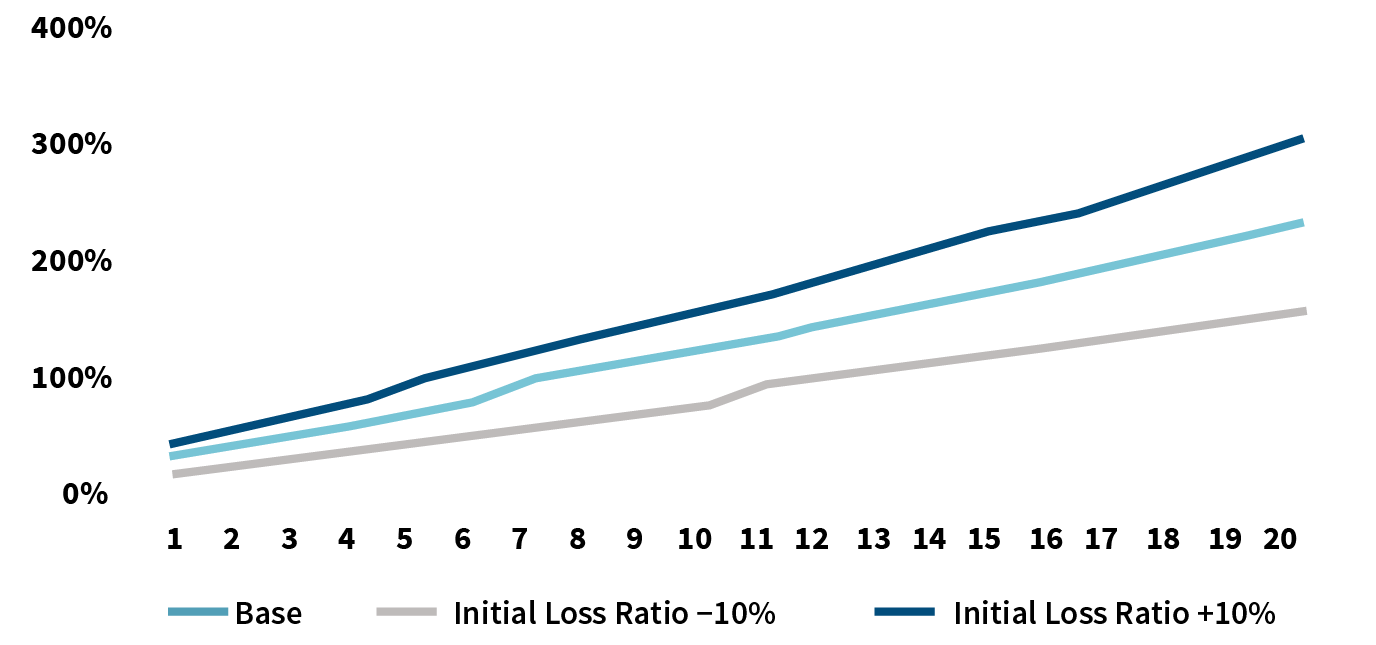
The initial loss ratio depends on the underwriting screening of the client, and this screening can affect the trend of loss cost. Improving the underwriting strength for long-term medical at the time of initial enrollment can effectively reduce anti-selection, keeping the initial loss ratio at a low level and delaying the timing and magnitude of future rate adjustments. For long-term medical, the management effect of the initial loss ratio is significantly magnified at the back end due to the high multiple increase in the forward loss ratio, as shown in Figures 1 and 2.
Figure 1: Effect of Initial Loss Ratio on Rate Adjustment
| Situation | Time for Rate Adjustment | Cumulative Magnitude of Rate Adjustment |
| Baseline | the nth year | x times |
| Initial loss ratio +10% | the (n–2)th year | 1.3x times |
| Initial loss ratio –10% | the (n+4)th year | 0.7x times |
Figure 2: Effect of Initial Loss Ratio on Loss Ratio Deterioration (Without Consideration of Rate Adjustment)
Key Risk Factor: Medical Inflation
The influencing factors of medical inflation usually include the change in price index, the shortage extent of medical resources, aging and so on. The spread of new technology is also contributing to medical inflation. Finally, advances in diagnostic technology and early diagnosis of diseases will increase the incidence of medical errors. However, the medical insurance fee control policy and the medical system reform can hedge the rise of medical costs to a certain extent.
The impact of medical inflation on long-term medical loss ratio is reflected in two main ways:
- Inflation leads to higher claim amounts
- Inflation leads to a decrease in the effectiveness of high deductibles and an increase in the probability of triggering a claim
Figure 3 shows the expected change in claim amount for three bill examples in an inflationary context. The numbers in red represent the increase in claim amount due to leverage failure, while the numbers in blue represent the increase in claim amount due to inflation.
Figure 3: Effects of Inflation on Claim Amount Bill
| Deductible | The First Year | The Second Year | … | The Fifth Year | |||
| Bill | Claim Amount | Bill | Claim Amount | Bill | Claim Amount | ||
| 10,000 | 9,500 | 0 | 9,785 | 0 | … | 10,692 | 692 |
| 9,800 | 0 | 10,094 | 94 | 11,030 | 1,030 | ||
| 10,200 | 200 | 10,506 | 506 | 11,480 | 1,480 | ||
Simulation of the probability of triggering a claim after an inflationary shock through historical bills clearly demonstrates the probability of exceeding the deductible increases gradually, as shown in Figure 4.
Figure 4: Inflationary Impact on Deductible Intercept Effect
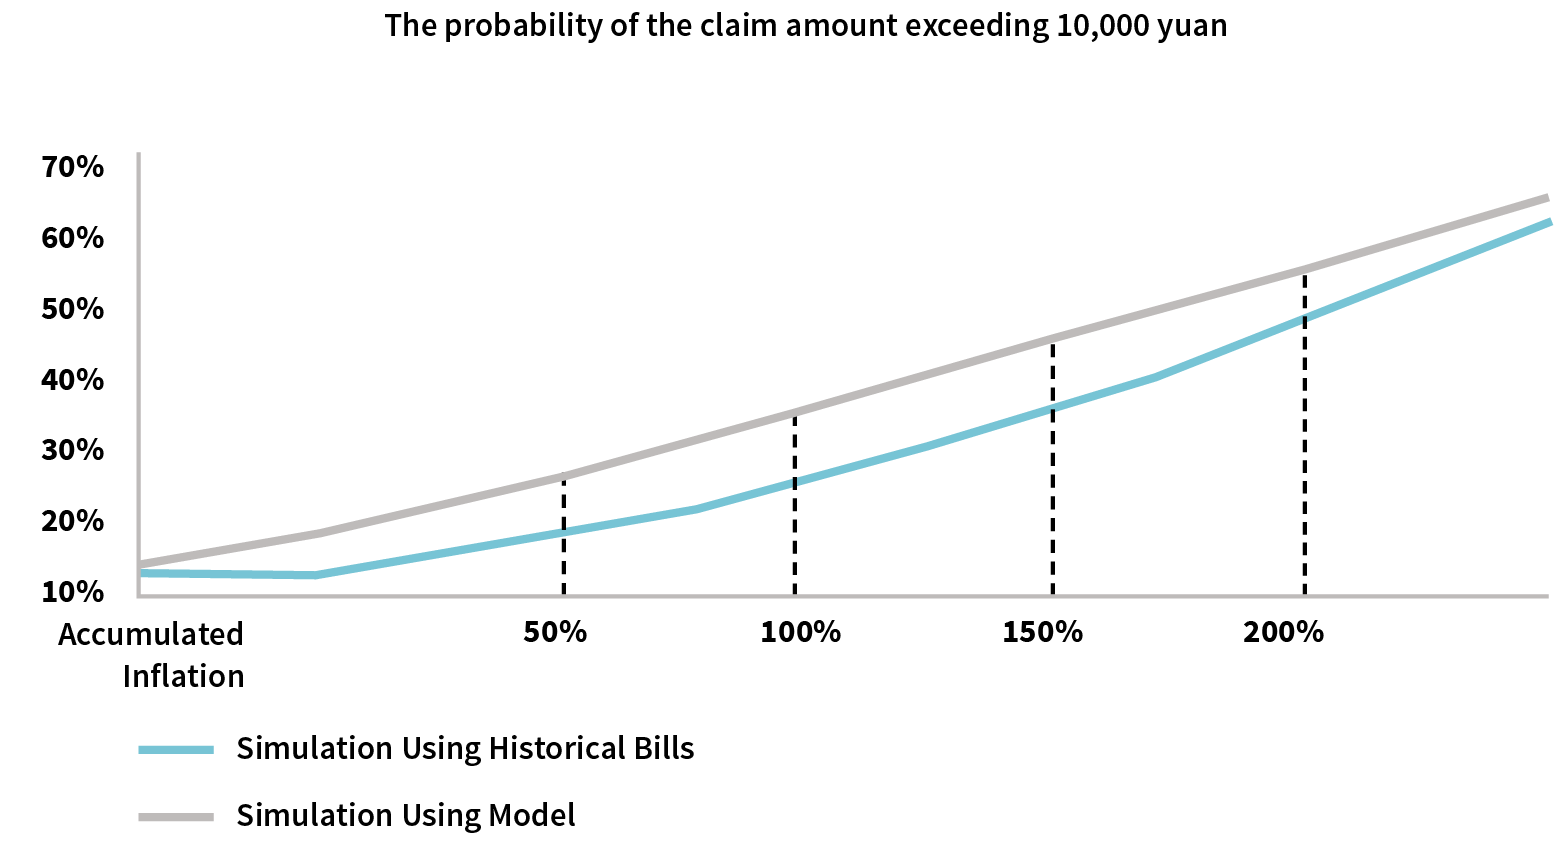
Based on historical billing characteristics, we build predictive models to anticipate claim expectations in an inflationary environment.
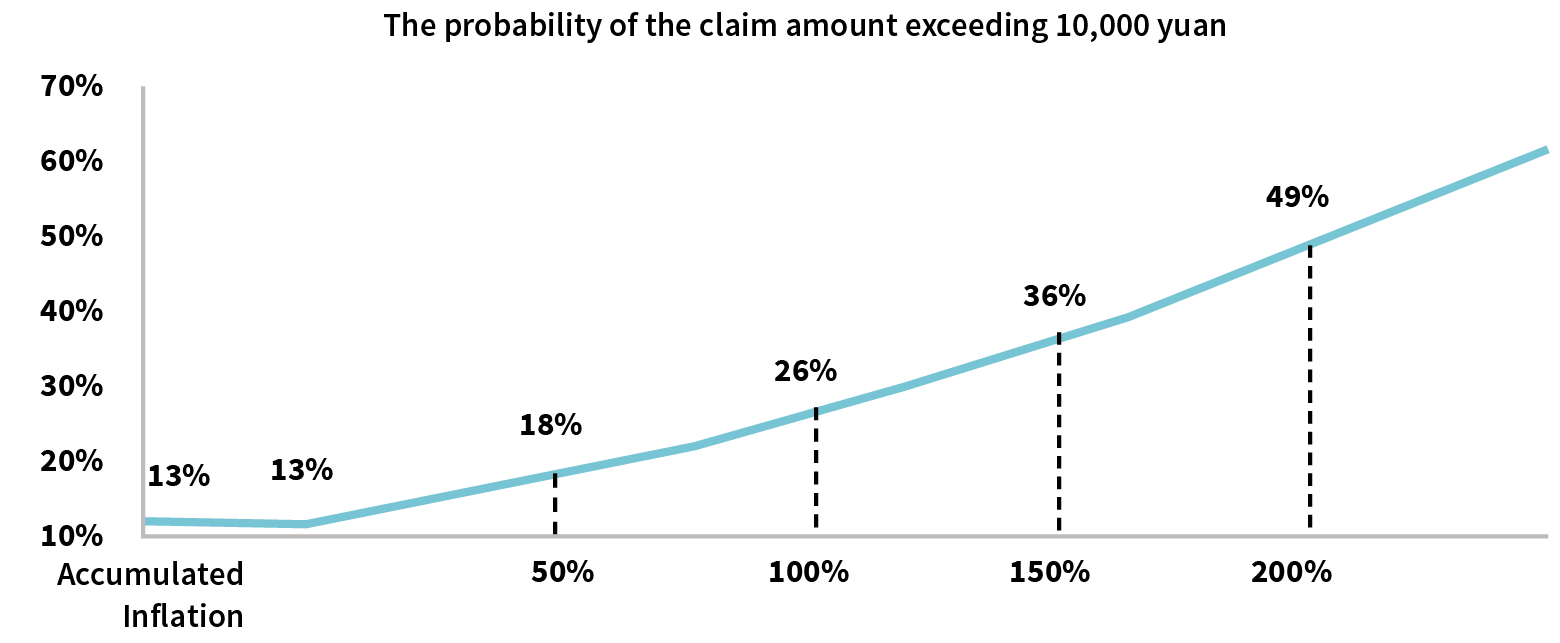
Step 1: Construct the probability that the claim amount exceeds the 10,000 yuan deductible. Considering that long-term medical has deductibles, and loss costs have non-negative, right-skewed and long-tailed characteristics, the lognormal, Gamma and Pareto distribution can be used for fitting. The lognormal distribution is chosen to fit in combination with the convenience of practical operation.
Based on the historical bills, the corresponding expected values and standard deviations are obtained and the corresponding distribution functions are constructed. We compare the simulation results with the historical bills and the function fitting results, and graphically, we can see in Figure 5 that the model prediction trend is close to the historical bills trend.
Figure 5: Historical Bills vs. Model Predicted Deductible Intercept Effectiveness Impact
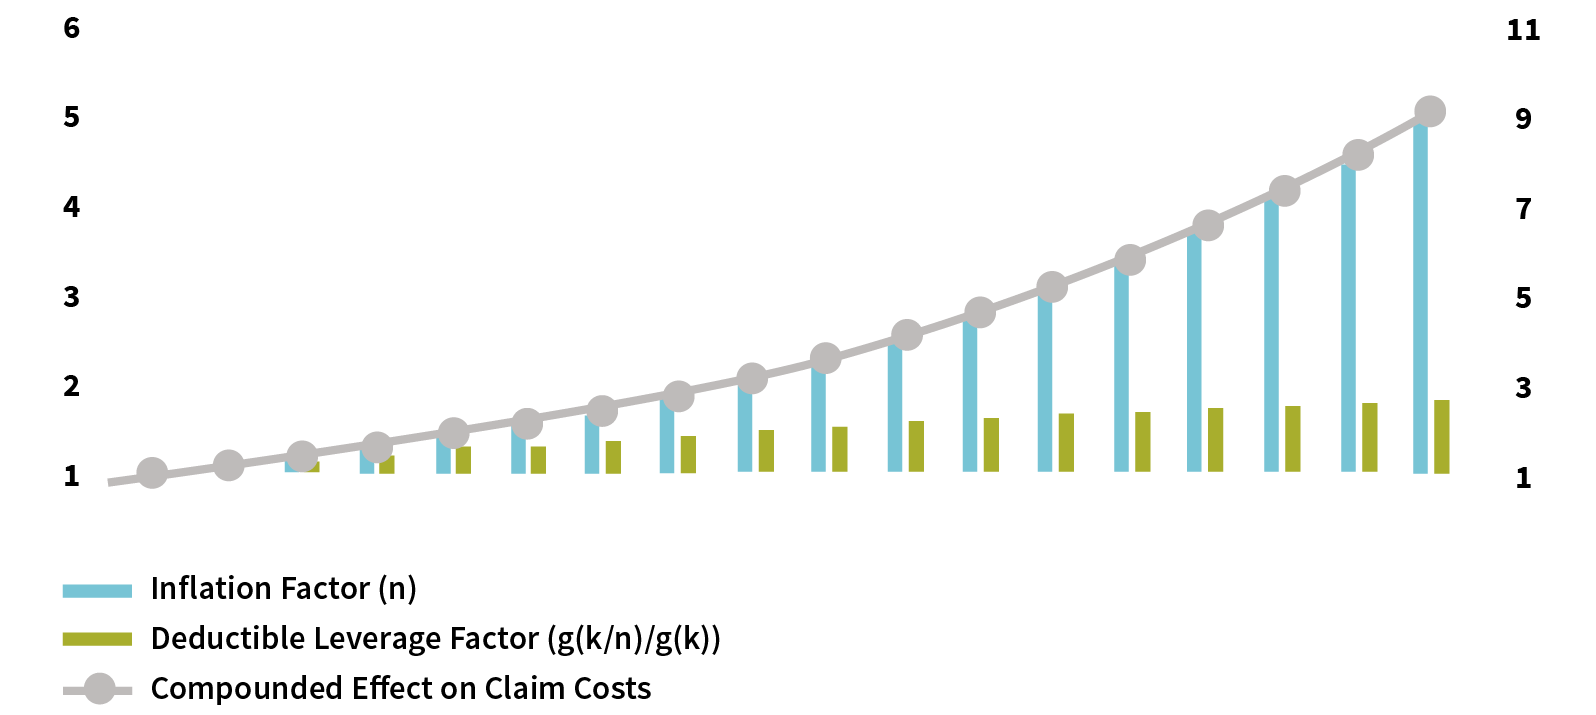
Step 2: Combine distribution functions and deductibles to calculate expected loss costs. Assuming that the out-of-pocket medical costs increase to n times the current costs in a future year, the ratio of loss cost to current loss cost is n*(g(k/n)/g(k)). The first term, n, is an extrinsic medical inflation factor; the second term, k, is the deductible; and g(k/n)/g(k) is the deductible leverage failure factor equal to the ratio of the post-inflation expected claim probability to the current expected claim probability to measure the deductible effect. The combined effect of the two drives up the late loss cost in a manner of the multiplier, as illustrated in Figure 6.
Figure 6: The Effect of Inflation on Loss Cost Under the Model
Key Risk Factor: Policy Progress
With the progress of the policy year, the underwriting selection effect gradually decreases, and the ongoing treatment of the impaired individuals brings the cumulative increase in the population of the impaired individuals year by year, resulting in higher loss costs. Specifically, first, the accumulation of impaired individuals brings a continuous increase in the loss ratio; second, the impaired individuals’ loss cost multiple, based on a high population base, will decay year by year. Note that there is uncertainty in the expected value of decay as medical technology improves. Figures 7 and 8 show the trend of increasing the percentage of impaired individuals and decreasing impaired individuals’ loss costs multiple year by year, respectively.
Figure 7: Example of Decay of Selection Effect—Percentage of Impaired Individuals
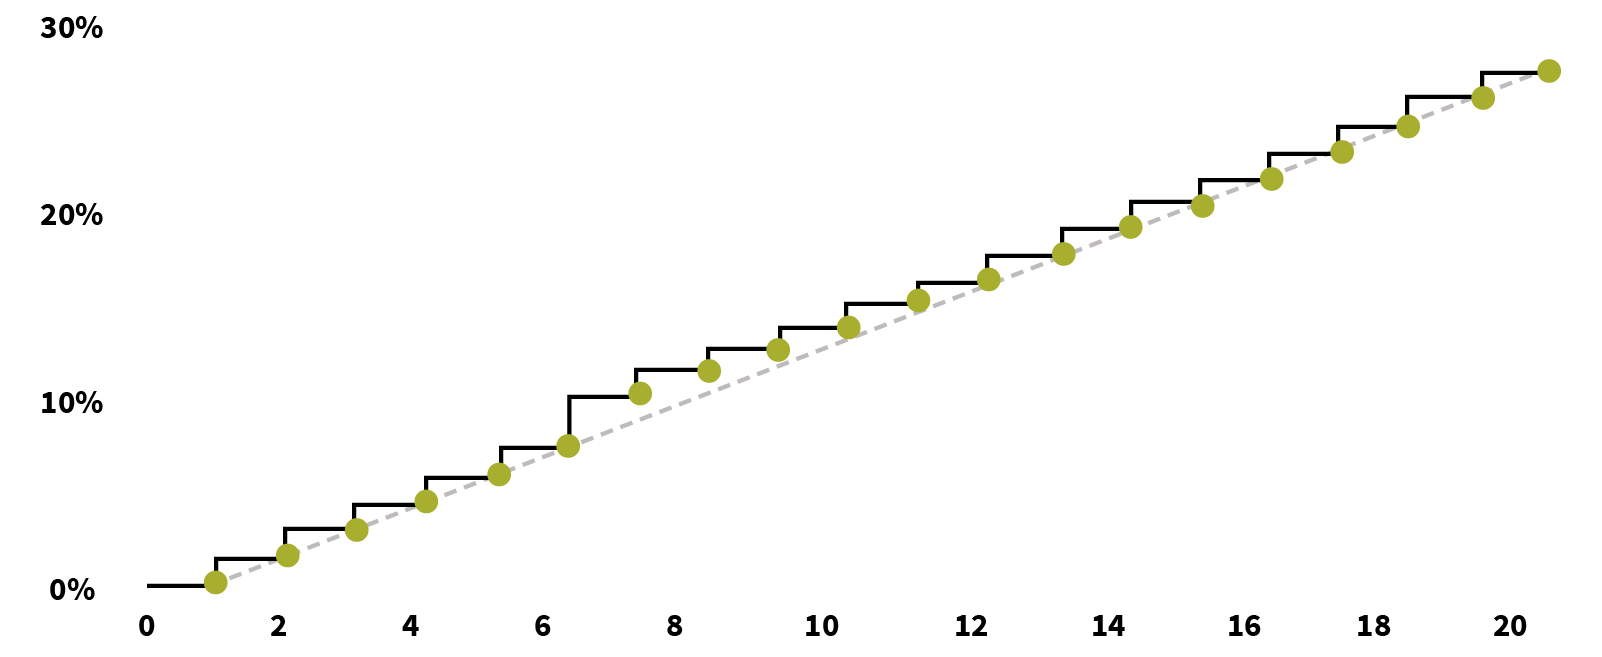
Figure 8: Example of Decay of Selection Effect—Loss Cost Multiple of Impaired Individuals
On this basis, we introduce the rate adjustment mechanism, and at the same time, we also bring in the fourth key risk factor: selective lapse.
Key Risk Factor: Selective Lapse
The continued rise in premium under the natural rate, as well as product rate adjustment due to rising loss cost, may lead to selective lapse of healthy individuals. The selective lapse of healthy individuals further increases the proportion of impaired individuals, bringing about further increase of the loss ratio. To identify the risk of selective lapse more clearly, the rate adjustment factor is taken into account in the loss ratio model.
Step 1: Introduce the rate adjustment mechanism into the overall loss ratio formula. Compared with the loss ratio before the adjustment, two adjustments were made:
- Premium dynamics were adjusted by adding the variable of policy year n.
- The healthy individuals will receive selective lapse due to the rate adjustment. The variable p is introduced to represent the retention rate after additional selective lapse due to the rate adjustment.
The formula for the loss ratio in year n after the rate adjustment (Rn) is expressed as follows:
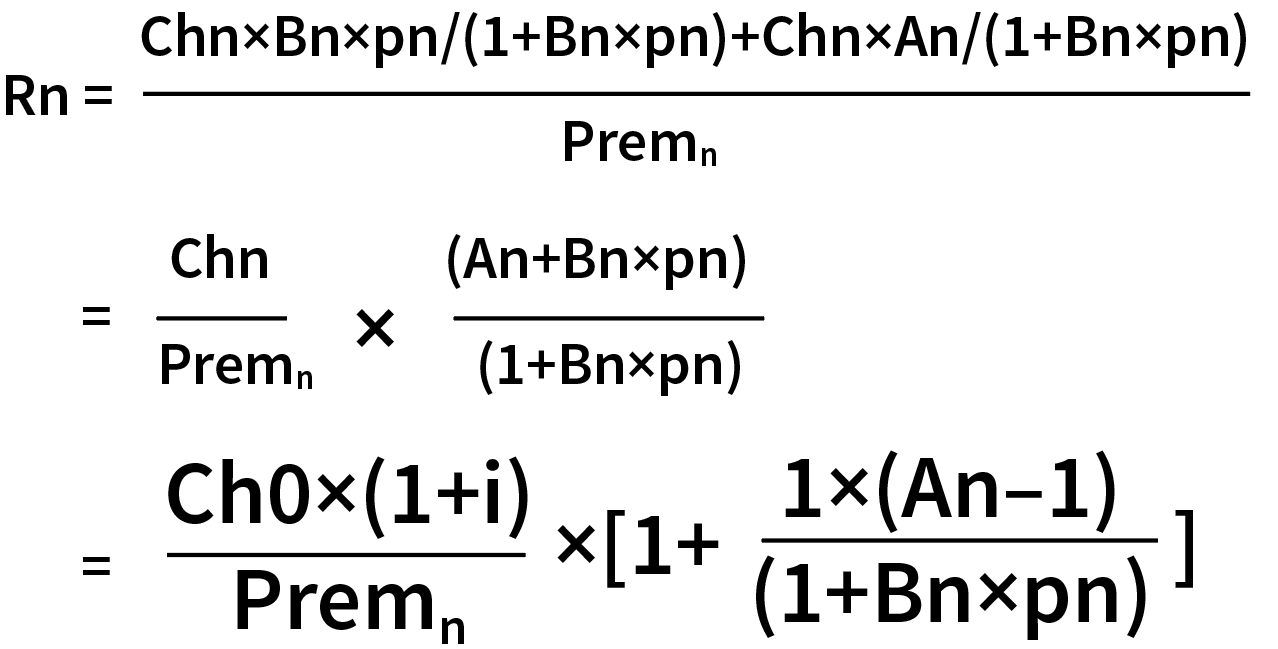
After simple deformation of the formula of loss ratio after rate adjustment, there are two changes compared with the formula before rate adjustment:
- The premium in the denominator is dynamic, which is no longer fixed
- The Bn in the denominator is multiplied by the healthy individual’s retention rate pn after rate adjustment
Based on the derivation of the formula, we can conclude that the effect of these two changes on the improvement of the loss ratio is a mutual constraint. On the one hand, the rate adjustment itself can reduce the loss ratio to some extent; on the other hand, the rate adjustment also may lead to a decrease in the retention rate of healthy individuals, which in turn will increase the loss ratio.
Step 2: Build healthy individuals retention model p. At time t, the retention of the healthy individuals after the rate adjustment obeys the binomial (n,p), and the parameter p denotes the retention rate of the healthy individuals. Whether the healthy individuals stay or not is strongly correlated with dividing the premium after rate adjustment by the healthy individuals cost (Ct). To this end, we fit a generalized linear model to obtain the healthy individuals retention rate (pt) formula:

- Parameter 1: Threshold of Ct—retention rate will plummet after exceeding the threshold
- Parameter 2: Threshold sensitivity—the higher the sensitivity, the greater the deviation
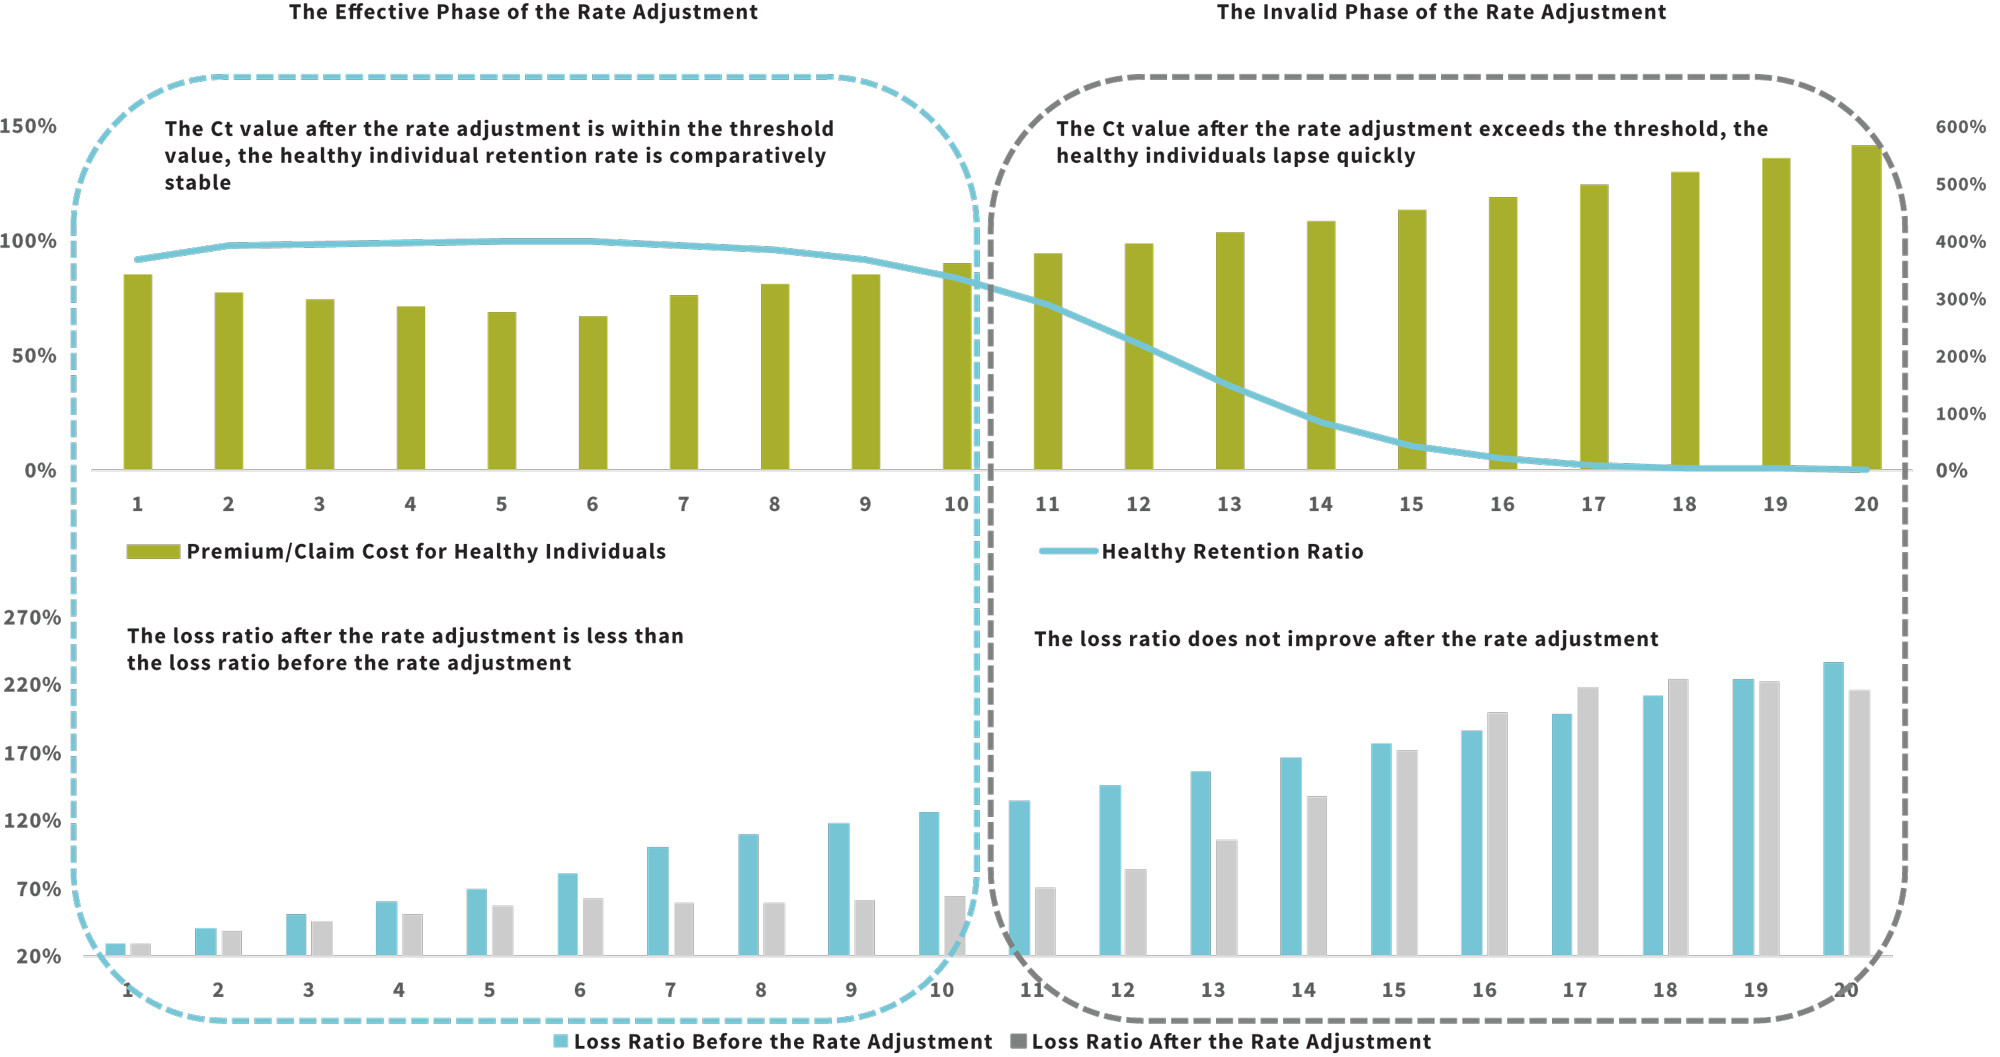
Step 3: Embed the healthy individual retention model into the loss ratio formula to see the impact of rate adjustment on healthy individuals’ retention and claims. In Figure 9, you can observe that the effect of the rate adjustment is divided into two phases:
- Phase 1—the Ct value after the rate adjustment is within the threshold value, the healthy individual retention rate is comparatively stable and the loss ratio after the rate adjustment is less than the loss ratio before the rate adjustment, which we call the effective phase of the rate adjustment.
- Phase 2—the Ct value after the rate adjustment exceeds the threshold, the healthy individuals lapse quickly and the loss ratio does not improve after the rate adjustment, what we call the rate adjustment lapse stage, which will enter the death spiral at a later stage.
This leads to the conclusion that a core element of long-term health care risk management is to keep rate adjustment in the efficient stage as much as possible.
Figure 9: Impact of Rate Adjustment on Healthy Individuals’ Retention and Loss Ratio
Discussion on the Management of Long-term Medical
Based on this risk analysis of long-term medical, we can manage each key risk factor from two perspectives: product design and operation management. Product design emphasizes layout before the business process and management around long-term medical product characteristics. Operation management emphasizes intervention during the business process and is based on the company’s operational characteristics. The core objective is to keep the product in the effective stage of rate adjustment.
Product Design
The core of management for product design is to control risk exposure and hedge inflation risk. There are four optional measures:
- Establish a positive list of medicines and devices, with the exception of liability for some expensive therapies and new drugs that are not universally available, to control the growth of medical costs arising from new medicines and devices.
- There is no fixed deductible, and deductibles increase on a yearly basis. Increasing deductibles hedge against the failure of leverage due to medical inflation to reduce future range of rate adjustment.
- Set a reasonable insurance period and payment limit to reduce the risk of future claims.
- Set a copayment ratio, and the customer pays for the excess of the limit according to the ratio to mitigate the tail-end risk of medical expenses.
All four of these measures aim to reduce the pressure of back-end rate adjustments. From a practical point of view, the feasibility of deductible increment and copayment ratio setting is relatively lower. Currently, long-term medical in mainland China is mainly through the positive list and high-tech, in addition to the insurance period and limit set to reduce the risk of claims.
Operation Management
We can manage risk around operational characteristics through product strategy, medical and health services, and institutional differentiation analysis.
Reduce the Impact of Initial Claim Costs on Future Claims by Matching Differentiated Products to Customer Subgroups
The effectiveness of the rate adjustment is influenced by both customer tolerance and the size of the Ct value. The size of Ct value is related to the degree of refinement of customer segmentation. Matching corresponding products according to the difference of customer segments can optimize the Ct value management. For customers with low purchase and loose underwriting requirements, it’s more suitable to match them with short-term medical insurance. For customers with moderate underwriting and purchase requirements, the initial loss ratio is relatively high and is expected to trigger rate adjustment earlier, and the insurance period shouldn’t be too long. For customers with high underwriting and purchase requirements, according to experience, the loss ratio is lower, the continuation rate is better, the rate adjustment is expected to be triggered later and a longer insurance period can be provided.
Full Process Management of Medical Practices to Reduce the Impact of Declining Underwriting Effect and Ongoing Treatment Effect
Reducing medical costs through medical practice management is the key to running long-term medical sustainably.
On the customer side, through health management services, providing standardized treatment plans for customers who are already sick and building the best treatment channel will help reduce medical costs. In addition, by providing chronic disease services and helping customers develop healthy lifestyle habits, this type of management will help reduce the incidence of major diseases.
On the hospital side, the direct settlement service can be used to detect medical trends, which allows administrators to optimize the management of unreasonable medical expenses to a certain extent. In addition, the establishment of a commercial health insurance drug catalog and a catalog of medical treatment items to scientifically include reasonable medical expenses outside the medical insurance catalog into the scope of coverage also helps to manage the claim boundary more proactively.
Adopt Differentiated Product and Management Strategies to Increase Healthy Customer ‘Stickiness’ and Reduce the Risk of Selective Lapse
In operation management, it is necessary to continuously encourage the retention of healthy customers by reducing the risk of selective lapse. We can make healthy policyholders feel like they are gaining something through health management value-added services. We can explore the combination model of universal insurance and long-term medical to hedge the rate increase with income. For the differentiated management of institutions, positive incentive and optimization of institutional continuation rate indicators are needed. The core purpose is to increase the stickiness and improve the retention of healthy individuals, and reduce the influence of the failure of rate adjustment.
Summary
The emergence of long-term medical further enriches China’s health insurance products, but it is more volatile compared to traditional health insurance. There are certain challenges in the operation process, with more emphasis on process management and refinement of management. It is important to grasp the core element of long-term medical risk management, which is to keep the rate adjustment in an effective stage during the product cycle.
This article is mainly based on Ping An Life’s work and team discussion. Special thanks to Sun Hanjie, Xie Junfeng, Wang Xuefeng and Yan Lan for participating in the discussion, and Deng Yuzheng for helping compile the article.
Statements of fact and opinions expressed herein are those of the individual authors and are not necessarily those of the Society of Actuaries or the respective authors’ employers.
Copyright © 2022 by the Society of Actuaries, Chicago, Illinois.